
- About the Journal
- Editorial Board
- Review Process
- Author Guidelines
- Article Processing Charges
- Special Issues
- Current Issue
- Past Issue
 Journal of Information Technology and Integrity
Journal of Information Technology and Integrity Volume 1 (2024), Article ID: JITI-102
https://doi.org/10.33790/jiti1100102Research Article
Deep Learning Models For Classification of Covid-19 Severity Levels
Olatubosun Olabode1*, Kolawole Gabriel Akintola2, Ebenezer Adeyemi4, Olufemi Rapheal Akinyede3, Babajide Afeni1, Akinbo Racheal1, Adekemi Iyabo Olabode4, and Sadura Pricilla Akinrinwa1
1 Department of Data Science, The Federal University of Technology, Akure, Nigeria.
2 Department of Software Engineering, The Federal University of Technology, Akure, Nigeria.
3 Department of Information Systems, The Federal University of Technology, Akure, Nigeria.
4 Federal Teaching Hospital Ido, Nigeria.
Corresponding Author: Olatubosun Olabode, Professor, Department of Data Science, The Federal University of Technology, Akure, Nigeria.
Received date: 29th May, 2024
Accepted date: 05th August, 2024
Published date: 07th August, 2024
Citation: Olabode, O., Akintola, K. G., Adeyemi, E., Akinyede, R. O., Afeni, B., Akinbo, R., Olabode, A. I., & Akinrinwa, S. P., (2024). Deep Learning Models For Classification of Covid-19 Severity Levels. J Inform Techn Int, 1(1): 102.
Copyright: ©2024, This is an open-access article distributed under the terms of the Creative Commons Attribution License 4.0, which permits unrestricted use, distribution, and reproduction in any medium, provided the original author and source are credited. Creative Commons Attribution License, which permits unrestricted use, distribution, and reproduction in any medium, provided the original author and source are credited
Abstract
In addition to clinical investigations, the RT-PCR testing is an alternative to the diagnosis of COVID-19 disease. This is considered the gold standard because it has the ability to find SARS-CoV-2 ribonucleic acid (RNA) that is located in the respiratory specimen. Radiologists interpret chest radiography (X-ray), to screen for COVID-19, by identifying visual indicators that is linked to SARS-CoV-2 viral infection. Radiologists also identify specific radiographic abnormalities in COVID-19-positive cases. Specifically, the ground-glass opacities, interstitial changes and bilateral abnormalities, in CT images and chest X-ray images are of interest in medical diagnosis. We propose a framework that combines clinical investigation, RT-PCR testing, and radiographic examination of (COVID-19) patients to accurately label chest X-ray images into the categories of mild, moderate, and severe. With chest X-ray images of patients with infection, we train a transfer learning VGG16 model and a developed convolution neural network (CNN) model to detect the presence of infection and classify it according to its severity level. This severity classification model can assist clinicians in prioritizing RT-PCR testing for COVID-19 confirmation and deciding on appropriate treatment strategies tailored to the infection's severity, given that different infection severities require varying treatment approaches. Our model was trained on datasets from public domains and local hospitals. We adopt Adam optimizer and a learning rate strategy that decreases if learning stagnates ('patience'). Hyperparameters for training include a learning rate of 2e−4, 20 epochs, a batch size 64, a decay factor of 0.7, and patience 5. Additionally, we implement a batch re-balancing strategy to ensure a more equitable distribution of infection types within each batch. We developed and evaluated our initial model prototype with the Keras deep learning and TensorFlow. The VGG16 network validation yielded impressive performance metrics, with specificity at 0.94, sensitivity at 0.91, and an F1-score of 0.92 for the COVID-19 severity classification. Similarly, the proposed CNN-based classification achieved high performance with specificity 0.91, sensitivity 0.91, and an F1-score of 0.91.
Keywords: Chest X-ray, Radiologist, Ground-Glass Opacity, Bilateral Abnormalities, Severity Level
Background Study
Severe Acute Respiratory Syndrome Coronavirus 2 (SARS CoV-2) is the causative agent of coronavirus disease in 2019. The disease was discovered in December 2019, in Wuhan, China, which subsequently led to the global pandemic. Even though, the World Health Organization (WHO) cleared the air in 2023, residual cases and variants of the disease still persist in society. Common symptoms of COVID-19, according to the [1] include dry cough, fever, and fatigue. Additional symptoms could be a sore throat, headache, diarrhea, conjunctivitis, nasal congestion, body aches, etc. The disease affected over seventy thousand individuals, resulting in more than eighteen hundred deaths within fifty days. The 2019 novel coronavirus (2019-nCoV) was identified as COVID-19 and the virus as SARS-CoV-2 [2]. The Symptoms and severity of COVID-19 may be mild, moderate, or severe, with fever, cough, and fatigue commonly observed in moderate cases. Severe cases can lead to fatal outcomes, like organ failure, and severe pneumonia. Although COVID-19 infection may elevate C-reactive protein (CRP), it does not solely determine disease severity. Additional factors such as clinical symptoms, imaging results (e.g., chest X-rays, CT scans), oxygen saturation levels, and other laboratory parameters (e.g., D-dimer, ferritin, lymphocyte count) are essential in assessing disease severity. Elevated CRP levels have been associated with severe COVID-19 cases, aiding in disease monitoring and treatment response [3]. Gaps in the literature suggest that, a standard label chest X-ray images of COVID-19 patient categorized into severity level does not exist.
Deep learning, is an advanced field mimicking human cognition, it shows promise in medical applications, particularly image analysis. This method has excelled in classification accuracy, noise resistance, and handling of large datasets. Researchers have utilized Convolutional neural networks (CNNs) [4] to detect and possibly classify many diseases based on X-ray images. Recent advancements in image recognition and computing resources have facilitated this progress [5,6].
Researchers have employed various algorithms and computational methods, including artificial neural networks, decision trees, genetic algorithms, and ensemble approaches, to enhance accuracy in diagnosing diseases [7-10]. Deep learning techniques leverage large annotated datasets and recent advancements in CNN architecture, to enable accurate medical image analysis [11-13]. However, our study explores how computational methods can mitigate the burden of COVID-19, by providing aid to healthcare professionals in disease diagnosis and management. So we applied the transfer learning model and proposed CNN architecture to identify COVID-19 presence and classify its severity levels (mild, moderate, and severe) using chest X-ray images.
Related Works
The global population continues to suffer greatly due to the infection of SARS-CoV-2, which caused the COVID-19 pandemic. An actual screening of patients is a critical initial step in combating COVID-19, enabling prompt isolation and medical intervention for those testing positive [14]. RT-PCR testing serves as the primary screening method to detect COVID-19 [15]. This method finds SARS-CoV-2 ribonucleic acid (RNA) in the respiratory samples that are usually taken with nasopharyngeal or oropharyngeal swabs [16-18].
Radiologists analyze chest radiography imaging as an alternative screening approach for COVID-19 to identify visual indicators of SARS-CoV-2 infection. Early studies demonstrate abnormalities in chest radiography images that are characteristic of COVID-19 infection [16,19,20], suggesting radiography examination as a potential primary screening tool in epidemic regions. The speed and ease of access to radiography exams are two benefits. Today, chest radiology imaging systems are widely available in healthcare facilities, including portable units that make them even more useful. This is because chest X-ray imaging is usually done for respiratory complaints [21].
Studies by [20,22,23] report that COVID-19-positive cases exhibit bilateral radiographic abnormalities, including ground-glass opacity and interstitial abnormalities in chest X-ray and CT images.
Gunraj et al., [24] identified the negative impact COVID-19 took in the pandemic on global health and therefore emphasized the critical role of effective patient screening in combating this disease. They evolve COVID-Net, a specialized deep convolutional neural network that is tailored towards detecting the disease from chest X-ray images. Early studies showing characteristic abnormalities found in the chest radiography images of patients motivated this initiative. The researchers established COVIDx, which is an open-access benchmarked dataset consisting of about 13,975 chest X-ray images from 13,870 patients, including a significant number of publicly available chest X-ray images of positive cases of COVID-19 [24].
Recent researches have demonstrated the use of artificial intelligence (AI), machine learning (ML), and deep learning (DL) techniques for automating the diagnosis of various medical conditions [25-28]. Islam et al., [29] research work on combining CNN and the Long Short-Term Memory (LSTM) networks to repeatedly detect COVID-19 from chest X-ray images was a testimony. LSTM performed classification based on the features extracted with CNN. The LSTM networks leverage internal memory to learn from past experiences, aiding in long-term state representation.
Shoeibi et al., [30] conducted a survey on automated COVID-19 detection and forecasting using deep learning techniques. Their survey highlighted DL's critical role in advancing COVID-19 diagnosis and prognosis through automated medical image analysis. The survey identified AI-driven approaches as crucial for enhancing the efficiency and accuracy of healthcare systems during the pandemic, and recommended prioritizing data quality, model interpretability, and ethical considerations to maximize their benefits.
Althanoon et al., [31] reviewed the application of machine learning techniques for COVID-19 detection and classification, emphasizing the urgent need for advanced diagnostic tools, particularly AI technologies like ML and DL. The study evaluated the effectiveness of AI-based methods in detecting COVID-19 from CT and X-ray images, underscoring the limitations of conventional RT-PCR testing. People saw the integration of AI technologies into clinical practice and public health strategies during the pandemic as transformative, but successful implementation requires addressing challenges such as data quality, interpretability, generalization, and ethical considerations.
In an attempt by [32] to solve the challenges of limited availability of labeled data, distortion, and complexity in image representation, as well as variations in contrast and texture, they developed a novel boosted CNN framework for COVID-19 infection analysis using radiological images. In the first phase of the framework, Split-Transform-Merge (STM) block and feature map enrichment (FME) approaches are integrated into a novel Convolutional Neural Network-based STM-BRNet. In order to identify COVID-19 infected CT slices, boundary and regional-specific information must be captured by the STM block. Furthermore, additional improved channels are developed to successfully capture minute fluctuations in illumination and texture particular to COVID-19-infected images by integrating the FME and Transfer Learning (TL) ideas into the STM blocks. Furthermore, by boosting at a high level through TL, residual multipath learning is utilized to enhance STM-BRNet's learning ability and gradually raise the feature representation. Using the recently created SA-CB-BRSeg segmentation CNN, the COVID-19 CT scans are processed in the second step of the study in order to precisely identify the infection in the pictures. A novel technique that blends smooth and heterogeneous processes in both the encoder and decoder is used by the SA-CB-BRSeg method. These methods are designed to efficiently capture border, texture variation, and region homogenous COVID-19 patterns. The SA-CB-BRSeg method exhibits its capability to precisely analyze and segment COVID-19 related data by integrating these techniques. Moreover, the SA-CB BRSeg model integrates the new idea of CB in the decoder, where more channels are joined via TL to improve low-contrast region learning. Impressive results are obtained with the created STM BRNet and SA-CB-BRSeg models: 98.01% accuracy, 98.12% recall, 98.11% F-score, 96.396% dice similarity, and 98.85% IOU [32]. The suggested framework will save workload and improve the radiologist's ability to make decisions regarding determining the COVID-19 contaminated region and assessing the disease's severity stages.
Materials and Methodology
Data Collection and Preprocessing
We compiled a sizable collection of chest X-ray pictures from COVID-19 patients with different levels of infection. We collected, cleaned, and stored its clinical information, X-ray images, and RT-PCR test results of each patient presenting with COVID-19 in a repository. We visited the National Hospital Abuja, the Federal Medical Centre Owo, the National Defense College Abuja, and the Medicare Hospital in Nigeria and access patients' medical case notes and reports of X-ray images and its TR-PCR test of COVID-19 patient for essential data collection. We populated the clinical dataset with information from patient case notes. The dataset contents information such as X-ray images, PT-PCR test results, age, sex [1 male, 2 female], Influenzas/Flu, Asy-1, and so on. or Symptomatic-2, Mild Fever (37–38), High Fever (>=38), Cough Sputum Hemoptysis, Dyspnea, Difficulty breathing, Sore throat, myalgias, nasal congestion, nausea or vomiting, diarrhea, chest pain, fatigue, headache, abdominal pain, weight loss, poor appetite, hypertension, malignancy, kidney disease, tuberculosis, and the disease Diagnosis [33]. Case notes were selected purposefully.
We dealt with the missing data by either imputation (replacing missing values with estimated ones) or by removing incomplete records. We check for and remove any duplicate entries in the dataset to ensure data integrity. We corrected any obvious errors or inconsistencies in the data, such as typos or invalid values, and we ensured that all measurements were in the same units and format.
Deriving new features that may be useful for analysis or modeling entails aggregating or transforming existing features or creating interaction terms between features. Depending on the nature of the variables, we converted categorical variables into a numerical format for modeling, which includes one-hot encoding, label encoding, or ordinal encoding. To address class imbalance, we consider techniques such as oversampling, under-sampling, or generating synthetic samples to balance the classes. We used techniques like principal component analysis or feature selection method to reduce the dimensionality while preserving relevant information.
We visualized the preprocessed data to gain insights and identify any remaining patterns or outliers that may require further investigation. We codify the dataset as Dataset 1. Chest X-ray image preprocessing involves loading the chest X-ray images into a preferred programming environment (e.g., Python using libraries like OpenCV, PIL, or scikit-image). Resize the images to a consistent size, say 224x224. We apply augmentation approach to data to increase the quantum and variability in dataset which then improve the robustness of the models. Common augmentation techniques for image data include rotation, flipping, shifting, zooming, and adjusting brightness and contrast. Optionally, we crop the images to ensure areas of interest are captured (e.g. chest area). We used histogram equalization or an adaptive histogram equalizer to improve contrast and image sharpness, improve their quality, and make important features more discernible. We reduce noise from the images by applying Gaussian blur, median filtering, and denoising algorithms like non-local mean denoising or total variation denoising. Normalize the pixel values across images to have a mean zero with a unit of variance. Figure 1 describes the flow and basic system concept of COVID-19 classification by severity level.
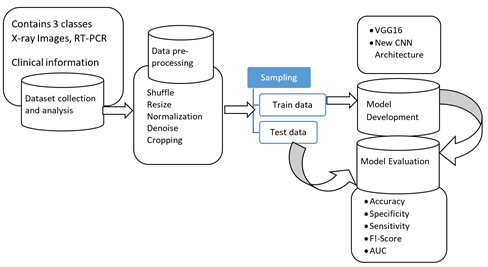
Figure 1: The Concept of the Transfer learning VGG16 and CNN models for categorical classification of COVID-19 by severity level
Convolutional neural network
Specifically designed for learning complex features from data, particularly in image processing tasks, is the CNN, which is a specialized type of multilayer perceptron. CNNs, in contrast to traditional neural networks, excel at capturing intricate patterns and find widespread application in object recognition, image classification, and medical image analysis [13,34-36].
CNN's core concept relies in its capability to extract local features from input data at higher layers and progressively combine feature extract to form more sophisticated features in subsequent layers. Several basic pieces, including convolution, pooling, and fully connected layers, are part of the CNN architecture. Sometimes stacks of many of these layers are repeated in a typical architecture.
The convolution layers involve a set of filters or sometimes called kernels, that slide over the input data to produce a tensor of feature maps. Each filter performs a convolution operation on the input using a specified "stride" of i: i=1, 2, ... to generate an output volume with reduced spatial dimensions [13,34,35,36]. You can apply zero-padding, which involves padding the input with zeros around its borders before applying convolution, to preserve the dimensionality of input volume. Mathematically speaking, the convolution operates as equ. 1:

equ.1
I*J indicates the convolution operation in a scenario where I, J and F are the input matrix and 2D filter with a size m×n, and 2D feature map output. This operation involves convolving the input matrix I with the filter K to produce a new feature map F. The ReLU activation function is used to add nonlinearity to the feature maps [37]. In neural networks, ReLU is a commonly utilized activation function. The ReLU function ReLU(x) has a mathematical expression of equ. 2.

equ.2
This activation function efficiently introduces nonlinear transformations within the convolutional layer, enhancing the network's capability to capture complex patterns in input data. To reduce parameter complexity, the pooling layer performs spatial down sampling of input dimensions. The predominant method, max pooling, selects the maximum value within specific input regions. Finally, the fully connected (FC) layer functions as a classifier, facilitating decision-making with dependence on features extracted from the convolutional and pooling layers.
Performance evaluation metrics
Creating a performance evaluation matrix for a three-category classification (mild, moderate, and severe) involves constructing a confusion matrix for the three categories (mild, moderate, and severe). It has this shape:
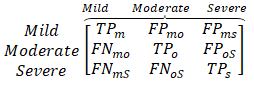
equ.3
where TPm, TPo, TPs: True Positives for mild, moderate, and severe respectively. FPmo, FPms, FPos: False Positives for mild predicted as moderate, mild predicted as severe, and moderate predicted as severe respectively. FNmo, FNms, FNos: False Negatives for mild predicted as moderate, mild predicted as severe, and moderate predicted as severe respectively.
Accuracy: Overall accuracy measures the proportion of correctly classified instances among the total instances. Accuracy =
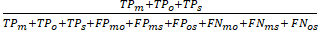
equ.4
Precision, Recall, and F1-Score for Each Class Precision (P): The proportion of true positives out of all predicted positives.
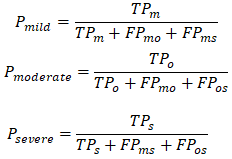
equ.5
Recall (R): The proportion of true positives out of all actual positives.
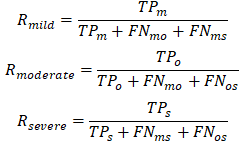
equ.6
F1-Score: The harmonic mean of precision and recall.
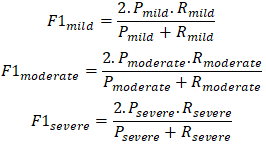
equ.7
Macro and Micro Averages Macro Average: Averages the metric for each class without considering class imbalance.
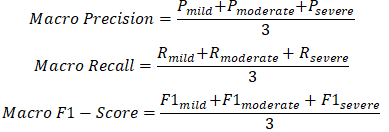
equ.8
This matrix allows for a comprehensive evaluation of a three category classification model, highlighting both individual class performance and overall performance across classes.
Experimental setup
In this experiment, VGG16 transfer learning model was used. We also constructed a new convolutional neural network, using the VGG16 as base model
VGG16 Transfer Model
The VGG16 architecture developed in Shozaki et al., [38], is a CNN specifically for image classification process. It takes input images of size 224x224 pixels with three color channels (RGB). VGG16 includes 13 convolutional layers arranged sequentially in 5 convolutional blocks. The blocks consist of multiple convolutional layers, and max-pooling layers. The convolution layers use small receptive fields (3x3 filters) with 1 stride and same padding. The max-pool layers employ a 2x2 window with a stride 2, reducing spatial dimensions while increasing depth.
After the convolution blocks, is the three fully connected layers, and each with ReLU activation function. The first two fully connected layers contain 4096 neurons each. The last fully connected layer serves as the output layer with 3 neurons, corresponding to 3 classes in the COVID-19 X-ray images (Severe, Moderate, and Mild). We used a well-labeled 3-category COVID-19 chest X-ray images dataset to train VGG16 transfer learning. The dataset was partitioned into three sub datasets: training (80%), validation (10%), and testing (10%). Using three RGB color channels, we scale the input images to 224 by 224 pixels before normalizing them [39].
TensorFlow, Keras, or PyTorch libraries were imported/used to train the VGG16 model. We replace the original output layer with a new fully connected layer that contains 3 neurons and softmax activation function specifically tailored to the 3-class dataset. We freeze certain layers of the VGG16 during training to prevent overfitting. We compile the model using an appropriate loss function, Adam optimizer, and evaluation metric. We train the model on the COVID-19 dataset using either fit method (TensorFlow/Keras) or the train method (PyTorch), closely monitoring metrics like loss and accuracy on both the training and validation modeling.
We evaluate the model's performance on the test set after training to assess its generalization ability, calculating relevant metrics such as F1-Score, accuracy, recall, and precision. Hyperparameter tuning includes defining the learning rate of 2e-4, maximum epochs of 20, batch size of 64, and a learning rate schedule with patience 5 and a decay factor of 0.7. We employ a batch re-balancing strategy [24] to ensure a balanced distribution of infection types at the batch level. Implementation of this experiment was carried out utilizing an Intel Core i7-2.2 GHz processor, an NVIDIA GTX 250 Ti GPU with 2 GB RAM, 16 GB system RAM, and 1TB storage.
New Convolutional Neural Networks
Utilizing the VGG16 architecture as the base model, we design a deep convolution network for COVID-19 chest X-ray image for severity classification. The input layer accommodates images of size 224x224 pixels with three color channels (RGB). Table 1 depict the architecture of the CNN.
The proposed model comprises 10 convolution layers arranged sequentially into four convolutional blocks. Each block contains multiple convolution layers, followed by max-pooling layers. To preserve spatial dimensions, the convolutional layers employ small receptive fields (3x3 filters) with 1 stride and the same padding.
Max-pooling layers utilize a 2x2 window with a stride of 2, reducing spatial dimensions while retaining depth. After the convolutional blocks, the model has three fully connected layers that are each turned on by ReLU activation functions [40].
The first two fully connected dense layers consist of 4096 neurons each. The final fully connected layer serves as the output layer with three neurons, which correspond to the three severity classes in the COVID-19 dataset categories. We tailor this architecture to extract and classify features relevant to severity level assessment of COVID-19 chest X-ray images. Table 1 presents the summary of the CNN model.
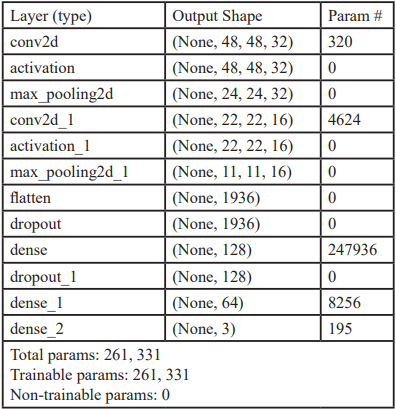
Table 1: CNN Model: "sequential"
Dataset
Our research integrates clinical investigation, RT-PCR testing, and radiography examination to accurately label chest X-ray images into the class of COVID-19 or non-COVID-19. Radiologists reviewed the radiographic findings, clinical diagnosis, and RT-PCR results to further classify confirmed COVID-19 cases into mild, moderate, or severe categories.
The primary dataset acquisition includes clinical information and diagnostic results from COVID-19 patient records, as well as RT-PCR results and chest X-ray images collected from the National Hospital, Abuja, the National Defense College, and the Federal Teaching Hospital, Ido. We source our secondary dataset compilation from various repositories (as detailed in Table 2), thereby enhancing the diversity and scope of our data analysis.
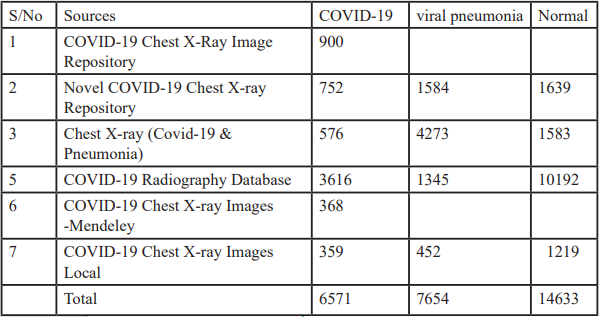
Table 2: Collated chest X-ray Images from open-source repository
Due to the unprecedented emergence of the COVID-19 outbreak, existing large repositories lack labeled COVID-19 data, necessitating the sourcing of images from diverse datasets encompassing normal, pneumonia, and COVID-19 cases [41].
These datasets collectively provide a comprehensive resource to studying and analyze chest X-ray images to aid detection and classification of COVID-19 cases into severity levels.
Results and Discussion
There are three categories in the dataset, Severe, Moderate or the Mild. We use the dataset1 with train_test_split function in keras to split and train the VGG16 model. Figure 2 is a graphical presentation of the accuracy and loss behaviour with respect to epochs=20 for VGG16. We also use the dataset1 to train our CNN architecture as describe previously. Figure 3 presents the graphical representation of the accuracy and loss behaviour with respect to epochs=20 for the CNN model.
The performance evaluation base on Accuracy, Specificity, F1- score, Precision, and Recall for the pretrained VGG16 mode and the proposed CNN is presented in Table 3. The confusion matrix for testing each of the models is also presented in Figure 4 for the proposed CNN and Figure 5 for the VGG16.
Figure 5, illustrates the confusion matrix depicting the testing phases of the CNN and the VGG16 on 10% of the dataset1. During Testing, the CNN model correctly classified 978 as severe, 479 as moderate and 338 as mild. Similarly, VGG16 model correctly classified 362 as severe, 332 as moderate and 313 as mild.
From Table 3, we could observe how well the CNN and the VGG16 classifier worked by showing its accuracy, specificity, F1-score, precision, and recall, on test dataset at 20 epochs and recall function. At epoch 20, the CNN achieved a test accuracy 91.1%. The VGG16 achieve e test accuracy of 94.2%. Details of the CNN performance is reported on Table 3.
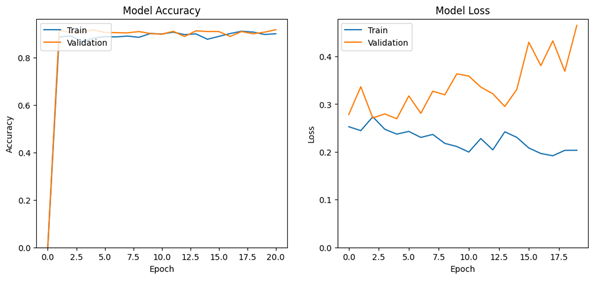
Figure 2: The loss and accuracy behaviour with respect to the number of epochs for VGG16 model
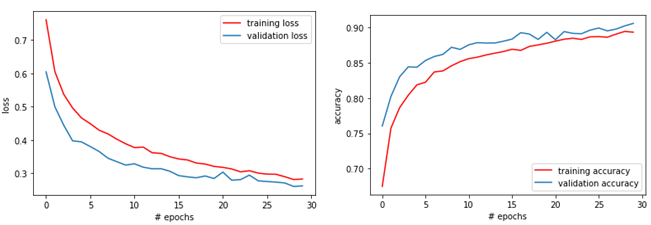
Figure 3: The loss and accuracy behaviour with respect to the number of epochs for CNN model
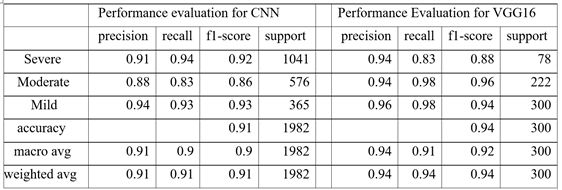
Table 3: Performance evaluation for Accuracy, Specificity, F1-score, Precision, and Recall, of the CNN and VGG16
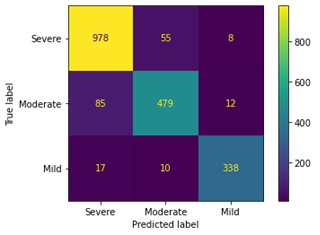
Figure 4: Confusion Matrix for the Test phase of the Proposed CNN model
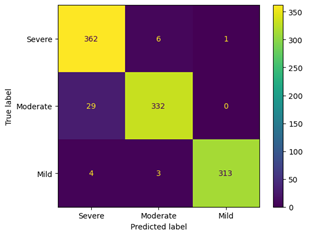
Figure 5: Confusion Matrix for the Test phase of the Proposed VGG16 model
Conclusion
Medical image classification, including the detection of COVID-19 in chest X-ray images and the categorization of infection severity levels, extensively utilizes deep learning techniques, particularly convolutional neural networks (CNNs). Recent research has shown that CNNs can be used successfully for tasks like analyzing chest X-rays and finding nodules on X-ray images of the lungs. CNNs can be trained from scratch or used in addition to traditional methods. Researchers are continually refining algorithms to enhance the accuracy of healthcare diagnoses, such as those related to heart disease. This research aims to alleviate the burden of COVID-19 by leveraging advanced computational methods. The developed deep learning model focuses on classifying COVID-19 infections based on their severity levels. It utilizes transfer learning VGG16 and CNNs to identify and categorize the severity of infection depicted in chest X-ray images into mild, moderate, or severe levels. This classification will aid clinicians in prioritizing individuals for RT-PCR testing and determining appropriate treatment strategies based on the severity of the infection. We trained the model using datasets sourced from both public repositories and local hospitals. We constructed and assessed initial model prototypes using the Keras deep learning library with a Tensor Flow backend. The VGG16 network validation yielded impressive performance metrics, with specificity at 0.94, sensitivity at 0.91, and an F1-score of 0.92 for the COVID-19 severity classification. Similarly, the proposed CNN-based classification achieved high performance with specificity 0.91, sensitivity 0.91, and an F1-score of 0.91. This model framework provides valuable support to clinicians in decision-making processes related to COVID-19 testing prioritization and treatment strategies tailored to infection severity levels.
Declaration
This research was funded by the Tertiary Education Trust Fund (TetFund) National Research Foundation of Nigeria (NRF) through the Centre for Research and Development (CERAD) at The Federal University of Technology, Akure, Nigeria.
Acknowledgement
We express our gratitude to the Federal Government of Nigeria for funding this research through the TetFund National Research Foundation of Nigeria (NRF). Additionally, we thank The Federal University of Technology, Akure, Nigeria, for their support via the Centre for Research and Development (CERAD). We acknowledge the National Hospital, Abuja, and the Federal Teaching Hospital, Ido, for providing essential Covid-19 and non-Covid-19 X-ray images and clinical data, which have significantly contributed to our research endeavors.
Conflict of Interests:
The authors declare that there are no conflicts of interest.
References
Podrecca, M., Sartor, M., & Nassimbeni, G. (2022). United Nations Global Compact: Where are we going? Social Responsibility Journal, 18(5).View
Lai, C. C., Shih, T. P., Ko, W. C., Tang, H. J., & Hsueh, P. R. (2020). Severe acute respiratory syndrome coronavirus 2 (SARS-CoV-2) and coronavirus disease-2019 (COVID-19): The epidemic and the challenges. In International Journal of Antimicrobial Agents (Vol. 55, Issue 3). Elsevier B.V. View
Jin, C., Chen, W., Cao, Y., Xu, Z., Zhang, X., Deng, L., Zheng, C., Zhou, J., Shi, H., & Feng, J. (2020). Development and Evaluation of an AI System for COVID-19 Diagnosis. MedRxiv, 2020.03.20.20039834. View
Priscilla Akinrinwa, S., Agbonifo, O. C., Akinrinwa, S., Olabode, O., Agbonifo, O., & Akintola, K. (2022). Breast Histopathology Images Multi-Classification using Ensemble of Deep Convolutional Neural Networks. International Journal of Scientific Research in Paper. Computer Science and Engineering, 10(6), 9-21. View
He, K., Zhang, X., Ren, S., & Sun, J., (2015). Spatial Pyramid Pooling in Deep Convolutional Networks for Visual Recognition. IEEE Transactions on Pattern Analysis and Machine Intelligence, 37(9). View
Krizhevsky, A., Sutskever, I., & Hinton, G. E., (2017). ImageNet classification with deep convolutional neural networks. Communications of the ACM, 60(6), 84-90. View
Adetayo, A. A., Olatubosun, O., & Terhemen, O. (2018). Predictive Sales Model using Multi-layer Neural Network with Backpropagation Algorithm. International Journal of Engineering Technology, 6(4). View
Olabode, O., Adetunmbi, A. O., Akinbohun, F., & Akinbohun, A. (2020). Application of Machine Learning for Diagnosis of Head and Neck Cancer in Primary Healthcare Organisation. European Journal of Engineering Research and Science, 5(4), 489-493. View
Olabode, O., & Olabode, B. T. (2012). Cerebrovascular Accident Attack Classification Using Multilayer Feed Forward Artificial Neural Network with Back Propagation Error. Journal of Computer Science, 8(1), 18-25. View
Olatubosun, O., Olusoga, F., & Abayomi, F. (2015). Diabetes Diagnosis with Maximum Covariance Weighted Resilience Back Propagation Procedure. British Journal of Mathematics & Computer Science, 6(5), 381-393. View
Deng, J., Dong, W., Socher, R., Li, L.-J., Kai Li, & Li Fei-Fei. (2010). ImageNet: A large-scale hierarchical image database. View
Russakovsky, O., Deng, J., Su, H., Krause, J., Satheesh, S., Ma, S., Huang, Z., Karpathy, A., Khosla, A., Bernstein, M., Berg, A. C., & Fei-Fei, L. (2015). ImageNet Large Scale Visual Recognition Challenge. International Journal of Computer Vision, 115(3). View
Tajbakhsh, N., Shin, J. Y., Gurudu, S. R., Hurst, R. T., Kendall, C. B., Gotway, M. B., & Liang, J. (2016). Convolutional Neural Networks for Medical Image Analysis: Full Training or Fine Tuning? IEEE Transactions on Medical Imaging, 35(5). View
Abubakar, M. E., Hasan, A., & Jha, K. N. (2022). Delays and Financial Implications of COVID-19 for Contractors in Irrigation Projects. Journal of Construction Engineering and Management, 148(9). View
Vijaya Baskar, V., Sivakumar, V. G., Vimal, S. P., & Vadivel, M. (2022). Deep Learning Analysis for COVID 19 Using Neural Network Algorithms. In Intelligent Systems Reference Library (Vol. 215). View
Ng, M. Y., Lee, E. Y. P., Yang, J., Yang, F., Li, X., Wang, H., Lui, M. M. S., Lo, C. S. Y., Leung, B., Khong, P. L., Hui, C. K. M., Yuen, K. Y., & Kuo, M. D. (2020). Imaging profile of the covid-19 infection: Radiologic findings and literature review. Radiology: Cardiothoracic Imaging, 2(1). View
Wikramaratna, P. S., Paton, R. S., Ghafari, M., & Lourenço, J. (2020). Estimating the false-negative test probability of SARSCoV- 2 by RT-PCR. Eurosurveillance, 25(50). View
Wolfel, R., Corman, V. M., Guggemos, W., Seilmaier, M., Zange, S., Müller, M. A., Niemeyer, D., Jones, T. C., Vollmar, P., Rothe, C., Hoelscher, M., Bleicker, T., Brünink, S., Schneider, J., Ehmann, R., Zwirglmaier, K., Drosten, C., & Wendtner, C. (2020). Virological assessment of hospitalized patients with COVID-2019. Nature, 581(7809). View
Ai, T., Yang, Z., Hou, H., Zhan, C., Chen, C., Lv, W., Tao, Q., Sun, Z., & Xia, L. (2020). Correlation of Chest CT and RTPCR Testing for Coronavirus Disease 2019 (COVID-19) in China: A Report of 1014 Cases. Radiology, 296(2). View
Huang, C., Wang, Y., Li, X., Ren, L., Zhao, J., Hu, Y., Zhang, L., Fan, G., Xu, J., Gu, X., Cheng, Z., Yu, T., Xia, J., Wei, Y., Wu, W., Xie, X., Yin, W., Li, H., Liu, M., … Cao, B. (2020). Clinical features of patients infected with 2019 novel coronavirus in Wuhan, China. The Lancet, 395(10223). View
Nair, A., Rodrigues, J. C. L., Hare, S., Edey, A., Devaraj, A., Jacob, J., Johnstone, A., McStay, R., Denton, E., & Robinson, G. (2020). A British Society of Thoracic Imaging statement: considerations in designing local imaging diagnostic algorithms for the COVID-19 pandemic. In Clinical Radiology (Vol. 75, Issue 5). View
Guan, W., Ni, Z., Hu, Y., Liang, W., Ou, C., He, J., Liu, L., Shan, H., Lei, C., Hui, D. S. C., Du, B., Li, L., Zeng, G., Yuen, K.-Y., Chen, R., Tang, C., Wang, T., Chen, P., Xiang, J., … Zhong, N. (2020). Clinical Characteristics of Coronavirus Disease 2019 in China. New England Journal of Medicine, 382(18). View
Trinayan, K. A., Sai, B. P., Akhilesh, P. S., Reddy, M. A., & Neetha, J. (2021). Computer-aided diagnosis system for Covid-19 by using deep transfer learning through X-ray images. 2021 12th International Conference on Computing Communication and Networking Technologies, ICCCNT 2021. View
Gunraj, H., Wang, L., & Wong, A. (2020). COVID Net-CT: A Tailored Deep Convolutional Neural Network Design for Detection of COVID-19 Cases From Chest CT Images. Frontiers in Medicine, 7. View
Ayon, S. I., Islam, M. M., & Hossain, M. R. (2022). Coronary Artery Heart Disease Prediction: A Comparative Study of Computational Intelligence Techniques. IETE Journal of Research, 68(4). View
Islam Ayon, S., & Milon Islam, Md. (2019). Diabetes Prediction: A Deep Learning Approach. International Journal of Information Engineering and Electronic Business, 11(2), 21-27. View
Lakshmanaprabu, S. K., Mohanty, S. N., Shankar, K., Arunkumar, N., & Ramirez, G. (2019). Optimal deep learning model for classification of lung cancer on CT images. Future Generation Computer Systems, 92. View
Rahaman, A., Islam, M. M., Islam, M. R., Sadi, M. S., & Nooruddin, S. (2019). Developing iot based smart health monitoring systems: A review. In Revue d’Intelligence Artificielle (Vol. 33, Issue 6). View
Islam, M. Z., Islam, M. M., & Asraf, A. (2020). A combined deep CNN-LSTM network for the detection of novel coronavirus (COVID-19) using X-ray images. Informatics in Medicine Unlocked, 20. View
Shoeibi, A., Khodatars, M., Alizadehsani, R., Ghassemi, N., Jafari, M., Moridian, P., Khadem, A., Sadeghi, D., Hussain, S., Zare, A., Alizadeh Sani, Z., Bazeli, J., Khozeimeh, F., Khosravi, A., Nahavandi, S., Rajendra Acharya, U., Member, S., Shi, P., Khodatars, M., ... Alizadeh, Z. (2020). Automated Detection and Forecasting of COVID-19 using Deep Learning Techniques: A Review A. Khadem is with the Faculty of Electrical Engineering. Arxiv.Org, 2007.
Althanoon, A. A., Abdulmajeed, A. A., & Saleem, N. N. (2023). Detection and Classification of COVID-19 Using Machine Learning Techniques: A Review. In Journal of Modern Computing and Engineering Research (Vol. 2023).
Khan, S. H., Alahmadi, T. J., Alsahfi, T., Alsadhan, A. A., Mazroa, A. Al, Alkahtani, H. K., Albanyan, A., & Sakr, H. A. (2023). COVID-19 infection analysis framework using novel boosted CNNs and radiological images. Scientific Reports, 13(1).View
Byanova, K., Kunisaki, K. M., Vasquez, J., & Huang, L. (2021). Chronic obstructive pulmonary disease in HIV. Expert Review of Respiratory Medicine, 15(1), 71–87.View
Gu, J., Wang, Z., Kuen, J., Ma, L., Shahroudy, A., Shuai, B., Liu, T., Wang, X., Wang, G., Cai, J., & Chen, T. (2018). Recent advances in convolutional neural networks. Pattern Recognition, 77.View
Hasan, A. M., Jalab, H. A., Meziane, F., Kahtan, H., & Al Ahmad, A. S. (2019). Combining Deep and Handcrafted Image Features for MRI Brain Scan Classification. IEEE Access, 7. View
Kutlu, H., & Avcı, E. (2019). A Novel Method for Classifying Liver and Brain Tumors Using Convolutional Neural Networks, Discrete Wavelet Transform and Long Short-Term Memory Networks. Sensors (Basel, Switzerland), 19(9).View
Singh, A. K., & Mohan, A. (2019). Handbook of multimedia information security: Techniques and applications. In Handbook of Multimedia Information Security: Techniques and Applications.View
Shozaki, H., Sekine, Y., Guttenberg, N., & Komatsu, G. (2022). Recognition and Classification of Martian Chaos Terrains Using Imagery Machine Learning: A Global Distribution of Chaos Linked to Groundwater Circulation, Catastrophic Flooding, and Magmatism on Mars. Remote Sensing, 14(16). View
Upadhyay, A., Dubey, A., Arora, V., Kuriakose, S. M., & Agarawal, S. (2022). FLNet: Graph Constrained Floor Layout Generation. ICMEW 2022 - IEEE International Conference on Multimedia and Expo Workshops 2022, Proceedings. View
Kevin Zhou, S., Fichtinger, G., & Rueckert, D. (2019). Handbook of medical image computing and computer assisted intervention. In Handbook of Medical Image Computing and Computer Assisted Intervention. View
Bennour, A., Ben Aoun, N., Khalaf, O. I., Ghabban, F., Wong, W. K., & Algburi, S. (2024). Contribution to pulmonary diseases diagnostic from X-ray images using innovative deep learning models. Heliyon, 10(9).View