
- About the Journal
- Editorial Board
- Review Process
- Author Guidelines
- Article Processing Charges
- Special Issues
- Current Issue
- Past Issue
 Journal of Political Science and Public Opinion
Journal of Political Science and Public Opinion Vol. 1 iss. 1 (Jan-Jun) 2023, Article ID: JPSPO-101
https://doi.org/10.33790/jpspo1100101Research Article
A Fractured Electorate? French Presidential Election Forecasting for 2022
Ross E. Burkhart
Professor, School of Public Service, Department of Political Science, Boise State University, United States.
Corresponding Author Details: Ross E. Burkhart, Professor, School of Public Service, Department of Political Science, Boise State University, United States.
Received date: 01st February, 2023
Accepted date: 25th April, 2023
Published date: 27th April, 2023
Citation: Burkhart, R.E. (2023). A Fractured Electorate? French Presidential Election Forecasting for 2022. J Poli Sci Publi Opin, 1(1): 101.
Copyright: ©2023, This is an open-access article distributed under the terms of the Creative Commons Attribution License 4.0, which permits unrestricted use, distribution, and reproduction in any medium, provided the original author and source are credited.Creative Commons Attribution License, which permits unrestricted use, distribution, and reproduction in any medium, provided the original author and source are credited
Abstract
This paper forecasts the first round of the French presidential election five months in advance. It uses a key industry-standard structural variable in its forecasting model, approval of the French president. Its parsimony allows for an early forecast, but its potential for error is higher. In the end, the forecast was somewhat off the mark, though it accurately showed the strength of a somewhat attenuated left. However, the structure of French political parties has changed dramatically over the past several years, leaving some doubt as to the reliability of this forecasting technique.
Introduction: Le Champ
This paper constructs a forecast of the first round of the French presidential election in 2022. The forecast is made five months prior to the election, in December 2021. The forecasting model utilizes a state-of-the-art independent variable, approval of the incumbent President, to forecast the vote for the political Left. This modeling technique is known as a structural model of French political behavior. Structurally speaking, French voters are hypothesized to reward incumbents, and incumbent parties, with their votes when they approve of their governments, and to blame the same actors for governments they dislike. The hypothesis is confirmed, with some qualifications, through analysis of presidential election and approval data from the past six decades. An interrogation of the structural method serves as the paper’s conclusion.
Contextually speaking, political change during the past several years was the constant across France and its neighbors leading into the presidential election, from the gilets jaunes unrest and COVID-19 vaccine protests in France itself, to completion of the British Brexit, to the conclusion of Angela Merkel's tenure as German Chancellor and key leader of the European content, and finally to the Ukraine War, the first continental war in three decades. Add to this general upheaval across the European Union regarding migration, economic decline, populist rise and the spread of COVID-19, and the chaotic continental political pattern continued apace.
Focusing on France, the destruction of the Fifth Republic establishment parties during the 2017 presidential election remains so. This is an unsurprising development considering the turbulent times, but it is still remarkable the extent to which the partisan landscape has changed in favor of reformers and populists, and against the establishment parties. For instance, the Parti Socialiste candidate for the presidency, Paris Mayor Anne Hidalgo, received 5% support in the November 2021 public opinion polls [1] and the Républicains candidate, Valérie Pécresse, received 14% support, well below the party standards from past election campaigns. Even the standard-bearer of the increasingly ascendant Rassemblement National (formerly National Front), Marine Le Pen, slipped below 20% support, with the slack taken up by the rank outsider on the extreme right, Éric Zemmour and his Reconquête movement.
Strangely enough, the most constant aspect of the most recent presidential campaign was the enduring 35-40% support for the insurgent 2017 presidential winner, Emmanuel Macron. An avowed centrist (and former Socialiste), Macron has studiously attempted to straddle the middle in navigating his presidency's way through a thicket of issues, from existential (the response to COVID-19) to identity-based (secularism). These political efforts appear to have given him a grudging respect for surviving during these treacherous times, though there is the suspicion among many that rather than being a principled centrist, he instead dove toward the center for the true Downsian median voter that in theory could propel him to a triumphal re-election.
How can we assess Macron’s progress on this quest? At the time of this forecast, he performed reasonably well. The November polling showed him about ten points ahead of his nearest competitor, Le Pen, 28% to 18%. Of course, this level of support is nowhere near the majority support required to end the election at one round. Macron's strategy hewed to the median center, with the task to survive to the second ballot, and receive the Arrowian voter second preferences on the second round to return to the Elysee Palace.
The Role of the Forecast
Of course, doing well today is no guarantee of success tomorrow. Hence, my French election forecasting effort attempting to foresee the election results in April 2022. Is it possible to forecast French elections? The evidence suggests that it is possible. Stretching back to the pioneering work of Michael Lewis-Beck [2], despite the small number of Fifth Republic presidential elections, they are remarkably well-behaved from the standpoint of hazarding a forecast of the impending election. Visual evidence of this is from the figure below. (This even includes the extreme outlier election of 2017, during which the French political world was irrevocably rocked.)

Figure 1
Along the horizontal axis are data of approval of the French president, six months prior to the election, stretching back to the 1965 election. Along the horizontal axis are data of the first-round vote for the presidential candidates on the ideological Left. (To make this graph work properly, the approval data are adjusted in the following way: for a president of the Left, the data are as is, while for a president of the Right, the data are 100 minus the approval data.) There is a definite upward slope to the data points, indicating a strong relationship between presidential approval and vote. This is confirmed by the Pearson correlation between incumbent popularity and Left vote, r = .84, N = 10. This suggests there is an evaluative logic to French presidential election voting that a forecasting model can potentially capture, to decent effect.
Forecasting Method
To forecast an election result, three things are essential: a good theory of voting, an accurate forecast, and significant lead time for the forecast. A reasonable voting theory to consider for forecasting is the "reward and punishment" theory first put forth by the Harvard political scientist V.O. Key in his book The Responsible Electorate [3]. In this scenario, voters are the "vengeful gods" who will vote for a government that performs well and against a government that does not. It is a relatively broad calculation for the voters to make, but the evidence suggests that make it, they do [4,7].
If presidential approval is a good proxy variable for government performance, and the literature suggests that it is (the spadework on this has been done in the U.S., [8,9] then presidential approval with appropriate lead time prior to the election should serve as a strong cue to the voters on Election Day. The approval data, sfive months prior to the election, for 1965 – 2007 come from Nadeau, Bélanger, and Lewis-Beck [10], and I have collected the data for 2012 from Ipsos [11] and 2017 from Ipsos [12].
Forecasting Model and Estimate
A basic model suggests itself, to be estimated with ordinary least squares regression:
Left Vote = a + b Incumbent Approval
The estimates are as follows:
Left Vote = 24.25 + .38 Incumbent Approval (5.97) (4.80)
R-squared = .77 S.E.E. = 4.10 Durbin-Watson = 2.01 N = 9
Where the variables are measured as stated above, the figures in parentheses are absolute t-ratios, the R-squared is the percentage of variance explained in the Left Vote DV by the Incumbent Approval IV, S.E.E. is the error in prediction of the DV by the IV, Durbin-Watson is the Durbin-Watson statistic for autocorrelation, N is the number of elections in the dataset, and the estimation technique is Cochrane-Orcutt AR(1) regression via Stata.
For a forecasting model, the R-squared value is of primary importance, as the model must account for the vote as precisely as possible. R-squared values above .70 are generally acceptable models for an accurate forecast, with the higher the value, the more accurate the forecast model. With this model's R-squared of .77, this model is sufficiently strong enough to render an accurate forecast.
The Forecast
What is the forecast? We simply plug in the relevant current value for Incumbent Approval and solve the equation. The relevant approval for Emmanuel Macron in November 2021 is 43 percent. This approval is on the lower end of presidential approval ratings, but it is certainly not catastrophic as in was in 2017.
The toughest call here is to characterize Macron: is he of the political center or of the left? His conduct while residing in the Élysée Palace suggests a centrist hue to his tenure in office. He was the economics minister in the Hollande government, so he also has some left credentials. On balance, his ideology is on the center-left, not the right, so we can declare his incumbent popularity for the left vote.
To solve the equation, then, the results are as follows:
Left Vote = 24.25 + .38 (43)
Left Vote = 24.25 + 16.34
Left Vote = 40.59% of the first ballot vote
Conclusion
This forecast tracks pretty well with the current levels of public support for the left candidates plus Macron, who together add up to around 45 to 49 percent of support. Despite all of the clamor associated with the far right, the forecasted vote for candidates on the left during the first round of balloting is likely to be substantial.
Postscript
How accurate was this forecast, made in December 2021, five months prior to the first round elections? Below are the first round results for the candidates on the left.
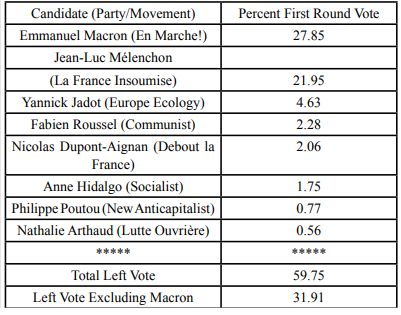
Table 1: First Round French Presidential Election Results for Left Candidates, 2022
The forecasted left vote was 19.2 percentage points too low if Macron is included in the tally, and 4.84 percentage points too high if excluding his total. We can conclude that the forecast was off by a fair margin. Yet it did show that the left would achieve a reasonable baseline of the first round vote, and well in advance of that vote, contrary to pundits who foresaw the complete vanquishing of the left. In fact, in 2017, sans Macron's vote, the left candidates combined for a first round vote percentage of 32.37, so for all of the hue and cry about the resurgent extreme right in France, it was really no different in support from 2017.
A deeper question is whether or not a modeling strategy like this one is sustainable, given the fracturing of the traditional left and right parties in France. Structural models need reliable indicators, election after election. The left-right placement that has been so standard for France may simply be less relevant in a polarized, populist, and pugnacious political arena. Time will tell, of course, but the lowered accuracy of the model in 2022 is further reason to test models repeatedly, and not rest on one's laurels.
Competing Interests:
The authors declare that they have no competing interests.
References
POLITICO. (2021). “Poll of Polls, France.” https://www. politico.eu/europe-poll-of-polls/france/View
Lewis-Beck, Michael S. (1991). "French National Elections: Political Economic Forecasts." European Journal of Political Economy 7:487-96.View
Key, V.O., Jr. (1966). The Responsible Electorate. Cambridge, MA: Harvard University Press.View
Kramer, Gerald H. (1971). "Short-Term Fluctuations in U.S. Voting Behavior, 1896-1964." American Political Science Review 65:131-43.View
Tufte, Edward R. (1975). "Determinants of the Outcomes of Midterm Congressional Elections." American Political Science Review 69:812-26.View
Lewis-Beck, M. S. (1988). Economics and the American Voter: Past, Present, Future. Political Behavior, 5-21. https://www. jstor.org/stable/586253View
Stimson, James A. (1991). Public Opinion in America: Moods, Cycles, and Swings. Boulder, CO: Westview Press.View
Sigelman, Lee. (1979). "Presidential Popularity and Presidential Elections." Public Opinion Quarterly 43:532-4.View
Lewis-Beck, Michael S., and Tom W. Rice. (1982). "Presidential Popularity and Presidential Vote." Public Opinion Quarterly 46:534-7View
Nadeau, Richard, Éric Bélanger, and Michael S. Lewis-Beck. (2012). “Proxy Models for Election Forecasting: The 2012 French Test,” French Politics 10:1-10.View
Ipsos. (2011). “Baromètre d’intentions de vote pour l’élection présidentielle: 6 décembre 2011 - Vague 7.” https://web.archive. org/web/20120131091757/http://www.ipsos.fr/sites/default/ files/attachments/2011-12-06-barometre-intentions-de-vote-vague-7.pdfView
Ipsos. (2016). “Enquête électorale française 2017”- Vague 9.”https://www.ipsos.com/sites/default/files/files-fr-fr/doc_ associe/rapport_cevipof_-_eef2017_vague_9_decembre_2016_ ipsos_le_monde.pdfView