
- About the Journal
- Editorial Board
- Review Process
- Author Guidelines
- Article Processing Charges
- Special Issues
- Current Issue
- Past Issue
 Journal of Political Science and Public Opinion
Journal of Political Science and Public Opinion Vol. 1 iss. 1 (Jan-Jun) (2023), Article ID: JPSPO-104
https://doi.org/10.33790/jpspo1100104Research Article
Shy Trumpers and Live Callers : An Analysis of The U.S. 2020 Polls
Clifford F. Thies
Professor of Economics and Finance, Shenandoah University, Winchester VA 22601 USA.
Corresponding Author Details: Clifford F. Thies, Professor of Economics and Finance, Shenandoah University, Winchester VA 22601, United States.
Received date: 06th July, 2023
Accepted date: 28th July, 2023
Published date: 31st July, 2023
Citation: Thies, C. F., (2023). Shy Trumpers and Live Callers : An Analysis of The U.S. 2020 Polls. J Poli Sci Publi Opin, 1(1): 104. doi: https://doi.org/10.33790/jpspo1100104.
Copyright: ©2023, This is an open-access article distributed under the terms of the Creative Commons Attribution License 4.0, which permits unrestricted use, distribution, and reproduction in any medium, provided the original author and source are credited.Creative Commons Attribution License, which permits unrestricted use, distribution, and reproduction in any medium, provided the original author and source are credited
Abstract
This study uses multiple regression to analyze more than 1600 state and nationwide polls released from April to November 2020 concerning the U.S. Presidential election of that year. The study finds that sample composition and survey-taking technology affected the results of these polls. Specifically, polls that over-sampled Democrats and polls that used live-callers were biased in favor of Biden. Live-caller bias almost certainly argues that polls suffered from Shy Trumpers. In addition, many poll-takers are found to be biased relative to a reference set of polls, independent of sample composition and the use of live-callers.
Keywords: Shy Trumper, Live-caller, Social desirability bias, Pre-election polls, House effects.
Introduction
In 2016, the polls were mostly correct but their prediction was wrong. In contrast, in 2020, the polls were mostly wrong but their prediction was correct. That is, as measured by the RealClearPolitics average, in 2016, the polls gave Hillary Clinton a 3-point edge over Donald Trump, close to what her actual lead in the nationwide popular vote (2 points) turned out to be. However, because of the distribution of the vote, Trump was elected President. In contrast, in 2020, the polls gave Joe Biden a 7-point lead over Trump, when his actual lead turned out to be 4 points. The election turned out to be close. A uniform nationwide shift of 1 point to Trump would have resulted in a tie in the Electoral College. Masking the relatively large quantitative error in the polls, Biden won.
Among the uncertainties during the campaign was the number of “shy” Trump voters, variously defined as voters who avoided polls altogether or who gave false answers to pollsters. Reflecting the view that the 2016 polls were mostly correct, Nate Silver [1] thought there was no evidence of “shy” Trump voters. Robert Cahaly [2] of the Trafalgar Group thought otherwise. He said that many Trump voters were reluctant to reveal their support to poll-takers since supporting Trump invoked a social desirability bias. Trump voters had no compunction against displaying their support at his huge rallies even amidst the coronavirus pandemic; but, stayed away from poll-takers like the plague.
Pollsters attempted to deal with the possibility of shy Trump voters through the use of multiple platforms (or, survey-taking technologies), short surveys, asking how friends and neighbors will vote, and weighting for education as well as the usual demographics. Even so, in real time many people were not persuaded by the polls showing Biden with a substantial lead. Among surveys that foresaw a comfortable Biden victory, some showed that many respondents thought Trump would win. Going into the election, London oddsmakers tabbed Biden as only a modest favorite; and, merchants in big cities boarded up their stores in anticipation of riots in the event of a Trump victory.
The obvious similarities between the 2016 and 2020 elections were Trump himself, Trump being behind in the polls, and his energetic campaigning and focus on the states crucial to winning the election. The most obvious differences included the coronavirus pandemic, the forced shut-down of the economy, and changes in the administration of the election in many states including heavy reliance on absentee mail and drop-off ballots. Less obvious differences included the insignificance of third-party candidates, low-number of undecided voters, and non-movement in the polls. The Libertarian Party, instead of welcoming Lincoln Chafee, a former Governor and U.S. Senator, to their party, nominated a party activist. The Democratic platform largely undermined the Green Party nominee. And, the possibility that Kanye West might play the role of spoiler was ended by chaotic petitioning, fastidiousness in enforcing deadlines and checking of signatures against voter rolls. Neither the Green Party candidate nor West appeared on the ballot in Arizona, Georgia, Nevada, Pennsylvania or Wisconsin. The election was almost all about turnout, which meant different things to each of the two major parties. For the Democrats, turning out the vote involved making sure low-propensity voters mailed-in or dropped-off their absentee ballots. For the Republicans, turning out the vote meant keeping Trump voters - who tended to be in-person, election-day voters - enthusiastic in the face of polls indicating that Trump had little chance of winning. A big part of the Republican campaign consisted of downplaying the polls. There was, it was claimed, hidden support for Trump.
In the United States, social desirability bias in the case of race is known either as the Bradley Effect or the Wilder Effect. Tom Bradley, an African American, was nominated by his party for Governor of California in 1982. Pre-election polls showed Bradley with a substantial lead. But, he lost. Douglas Wilder, also an African American, was nominated by his party for Governor of Virginia in 1989. Pre-election polls also showed Wilder with a substantial lead. He only narrowly won. Hopkins [3], analyzing 180 Governor and U.S. Senate races from 1989 to 2006, finds that there was significant poll bias in elections involving African American candidates prior to the 1990s, and none since. The latter finding was reinforced by the results of the 2008 Presidential election [4,5].
Bishop and Fisher [6] examine the interplay of poll-taking methodology and social desirability bias in Wilder’s case. Two exit polls were conducted. One involved face-to-face interviews, the other self-administered questionnaires. The exit poll based on face-to-face interviews was much more favorable to Wilder than the exit poll based on self-administered questionnaires as well as much more favorable than the actual results. Kreuter, Presser and Tourangeau [7] compare social desirability bias by mode of interview in an experimental setting, and find live-caller telephone interviews to be the most problematic.
In the United Kingdom, a phenomenon similar to social desirability bias is known as the Shy Tory Effect1. Polling in Great Britain tends to overstate support for Labour and understate support for the Conservatives, nicknamed the Tories. This tendency is most noticed when the polls miscall the result of a national election as happened in 1992 and 2015. In 1992, the pre-election polls showed Labour ahead in the popular vote by 1.8 percent, when the Conservatives won by 7.6 percent [8](Table 3, p. 243). In 2015, the pre-election polls showed the Conservatives ahead by 0.6 percent (and thus predicted a hung Parliament), when they won by 6.6 percent (with a majority in Parliament)[9] (Table 1, p. 12).
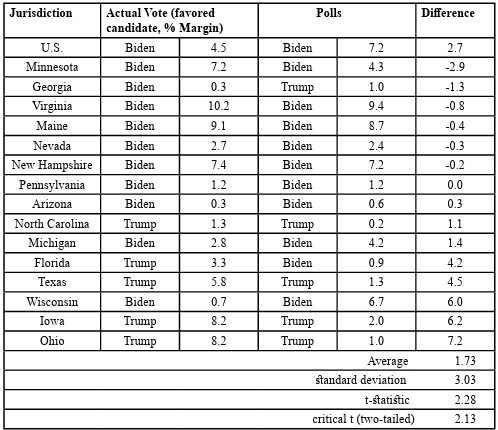
Table 1: Actual vote versus final pre-election polls, U.S., 2020
Following the 1992 polling disaster, various reasons for the miscall were considered including (1) a late swing in voter intentions, (2) closet Conservatives (or, Shy Tories), and (3) faulty quotas. Jowell, et al. [8] discuss the possibility that a “shame factor” may have attached to working-class voters choosing the Conservatives, since they were putting their self-interest (in lower taxes) over their class-interest (in expanded social welfare programs). Jowell, et al., [8] however, were skeptical of the magnitude of the effect.
After the 2015 polling miscall, the polling industry commissioned a study [9] to investigate the matter. The study concluded that the main culprit for the error was unrepresentative samples. In particular, the study found that there was no difference in the accuracy of final pre-election polls conducted by telephone versus those conducted online (p. 59). However, during the short campaign period and at various other times since the prior election, the telephone polls fa-vored the Conservatives relative to the online polls. That when the telephone polls exhibited a difference they favored the Conserva tives, undermines the Shy Tory argument and supports problems with sample composition being the reason for the miscall.
On the heels of the 2015 polling miscall in the U.K. came the seem-ing 2016 polling miscall in the U.S. For some, “Shy Trumpers” was simply swapped for “Shy Tories”; and, social desirability bias based on race was replaced by social desirability bias based on gender. However, measurements of social desirability bias ranged from zero to small (albeit, statistically significant). During the primary sea-son, Dropp [10] found a significant difference in support for Trump among Republican and Republican-leaning voters in randomized live-caller versus automated-caller and online surveys. During the general election season, Brownback and Novotny [11] found that self-described Democrats expressed greater agreement with Trump in an implicit relative to an explicit format, in a randomized live-call-er poll. However, in similar investigations, Claassen and Ryan [12] and Coppack [13] found no difference. After the election, Kellyanne Conway, Trump’s campaign manager, said that Trump’s hidden sup-port came from people whose demographics “said” Democrat but whose expressed values “said” Republican. She said hidden Trump supporters were reluctant to express their support because they want-ed to maintain friendships and other relations [14].
Prosser and Mellon [15], examining the history of modern poll-ing, find that accuracy has always been a problem. They find little evidence that polling errors have been due to “shy” voters. Instead, they find the main reasons for error to be unrepresentative samples and weighting, and late-deciding voters. Thies [16] shows that, when properly weighted, the Chicago Record Poll of 1896 would have de-livered useful forecasts of that year’s Presidential election in spite of massive non-response bias2.
Following the 2016 election, AAPOR [17] conducted a study of the pre-election polls. The study concluded (p. 2) that the national polls were “generally correct,” and that state-level polls “showed a competitive, uncertain contest … but under-estimated Trump’s sup-port in the Upper-Midwest.” The study attributed Trump’s surprising victories of several crucial states to three factors, in order of impor-tance: (1) late changes in voter preferences, (2) failure of poll-taking organizations to weight for education, and (3) greater non-revealing by Trump voters relative to Clinton voters. Greater non-revealing by Trump voters would be due to some combination of late-deciding and Shy Trumpers, but the existence of Shy Trumpers was not sup-ported by other tests (pp. 2-3).
In 2020, the pre-election polls called the winner of the election correctly, but were wrong about the margin of victory. Table 1 pre-sents the final pre-election poll average for the U.S. and for each of the battleground states having more than two pre-election polls in RealClearPolitics. As already mentioned, the nationwide margin was off by 3 points. State margins ranged from understating Biden’s mar-gin by 3 points to overstating his margin by 7 points. The average of these margins (nationwide and state) is 2 points. This “error” might reflect a hidden Trump vote. However, it is not satisfactory to simply assert that this error is the hidden Trump vote.
AAPOR’s [18] evaluation of the 2020 polls is more definitive with respect to what did not cause the polling error (p. 4), than what-caused it (pp. 5-6). In particular, the polling error was not caused by late-deciding voters, nor by incorrect demographic weights, nor by the failure to weight by education, nor by polling method, nor by Shy Trumpers among those choosing to participate in polls. However, in a series of footnotes, the study indicates that some people avoid polls altogether, and probably more Republicans than Democrats. The study noted the large difference in the partisan composition of the pre-election polls when contrasted to the exit poll and to voter files in states where voters register by party, but said “it is impossible to in-terpret the results … as revealing the cause of polling error.” (p. 66)3
Comparing the Exit Poll to voter registration data, Joshua D. Clin-ton, John S. Lapinski and Marc J. Trussler [19] find that Democrats were more likely to respond than Republicans and independents by 3 and 6 percent, after controlling for the demographics and a variety of other factors.
Some additional evidence of a Shy Trump Effect is found in reports of self-censorship by Trump voters at family get-togethers and oth-er social gatherings, at work and elsewhere. A New Hampshire poll indicates that two-thirds of Trump voters said they would not put a Trump sign in their yard or a bumper sticker on their car for fear of being vandalized [20]. A Cato Institute poll indicates that large numbers of Americans are reluctant to share their political opinions, more so in 2020 as compared to 2017 [21]. While the percentage is higher among conservatives, many liberals as well as conservatives express this reluctance. Among strong liberals, 50 percent support firing Trump donors. Among strong conservatives, 36 percent sup-port firing Biden donors.
In a post-election survey, Sabato, et al. [22] find that majorities of both Biden and Trump voters believe that Americans who strongly support the other party are a “clear and present danger,” and support censorship “despite the U.S. Constitution’s First Amendment protection of freedom of speech” (Table 2). Pluralities of both Biden and Trump voters want the President to “take needed actions without being constrained by either Congress or the courts.” (Table 3)
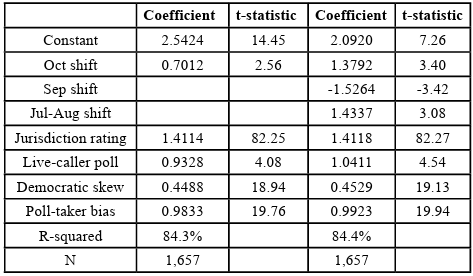
Table 2: Regression analysis of Biden’s margin, state and nationwide polls, 2020 U.S. presidential election
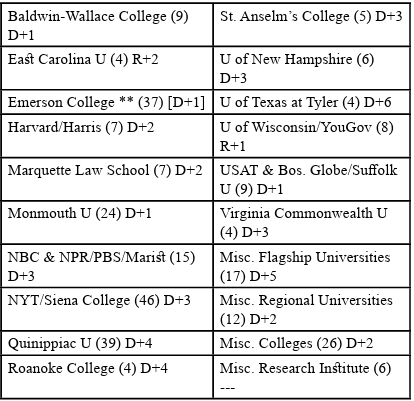
Table 3: Estimated poll-taker specific bias, academic institutions Number of polls in parentheses; *includes partisan composition bias; **reference group; if in reference group, bias on a stand-alone basis in brackets.
Method
During the 2020 campaign, hundreds of polls were released. These included nationwide and state polls conducted by public poll-taking organizations and private polls released to the public for various pur-poses. Among these poll-taking organizations, some issued many polls and others only one or two. In many cases, internal data such as the partisan composition of the sample were released along with the toplines. To analyze these polls for sources of systematic error, bias, or hidden Trump voters, the 538 website was used as a clearinghouse to identify all polls covering the period from April to the election that provided partisan composition or else were from polling organiza-tions that released dozens of polls4 . A total of 1,657 polls were iden-tified, having an aggregate sample size of 2.35 million respondents. Multiple regression is used to analyze these polls, in contrast to the discrete analysis (one type of poll at a time) conducted by AAPOR. With this method, the deviation of the polls from the election results is decomposed into sample composition and live-caller bias, and poll-taker specific bias.
Results
Table 2 presents the final form of a regression in which Biden’s margin over Trump is the dependent variable. This form resulted from three systematic searches:
(1) For the reference set of polls,
(2) For movements over the sample period, and
(3) For poll-specific bias (or, house effects) (constrained to a whole number) relative to the reference set of polls.
The possibility of movement in the polls was explored with a series of linear splines. Potentially, the polls could have shown an intricate pattern of movement. But, only a few movements proved to be significant. Poll-specific bias was estimated iteratively for poll-taking organizations that released at least four polls (these estimates are given in Table 4), and for seven residual groups of polls. Included among these seven residual groups are polls conducted by flagship universities, regional universities and small universities and colleges.
The reference set of polls was initially set as the three poll-taking organizations in RealClearPolitics’s final pre-election poll average that came within 1 point of the correct margin. These were: Investor Business Daily/TIPP, Hill/Harris and Emerson College. Each of these polls was conducted primarily online or by automated caller, and routinely published internals. After some preliminary analysis, the polls of three other poll-taking organizations were added to the reference group: Atlas Intelligence, Landmark Communications and Zogby5.
The possibility of movement in the polls was explored with a series of linear splines. Potentially, the polls could have shown an intricate pattern of movement. But, only a few movements proved to be significant. Poll-specific bias was estimated iteratively for poll-taking organizations that released at least four polls (these estimates are given in Table 4), and for seven residual groups of polls. Included among these seven residual groups are polls conducted by flagship universities, regional universities and small universities and colleges.
With the final form of the regression, the intercept and the first several independent variables control for the distribution of voter intentions across the time and space dimensions of the sample. The intercept gives the starting margin for Biden independent of live-caller, sample composition and poll taker-specific bias. In the first specification, the coefficient on the variable “Oct shift” indicates that Biden’s margin increased during the final month of the campaign. This shift could reflect any number of developments, including Trump’s poor performance in the first Presidential debate and continuing difficulties with the coronavirus pandemic and the shut-down of the economy. The second specification is more intricate. It suggests a rise in Biden’s margin following his securing of his party’s nomination and a narrowing of his margin following the Republican national convention, prior to the October shift to Biden.
The October shift to Biden seems to be at odds with the 2020 Exit Poll. The Exit Poll indicates that voters who made their decisions during the month prior to the election broke in favor of Trump 51 to 46 percent. A possible reconciliation of the pre-election and exit polls is that there was a last-minute surge in turnout (necessarily, in-person, election-day voters) of persons who had recently decided to vote for Trump.
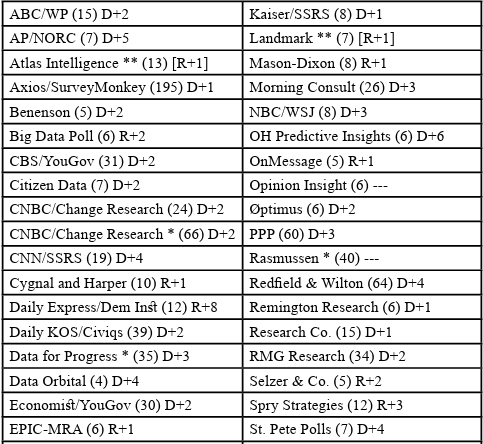
Table 4: Estimated poll-specific bias, not academic institutions Number of polls in parentheses; *includes partisan composition bias; **reference group; if in reference group, bias on a stand-alone basis in brackets.
The variable “Jurisdiction rating” reflects Cook’s Partisan Rating (based on past voting in Presidential elections), partisan affiliation (based on several large surveys from the 2016 Exit Poll to prior to the 2020 election) and registration where voters register by party. It does an effective job controlling for differences in partisan orientation across the country.
Turning now to the variables of interest, “Live Caller” denotes surveys conducted primarily by live telephone callers. It enters the regression with a coefficient of about 1, indicating that live-caller polls tended to favor Biden by that amount. While only 27 percent of the polls in the sample are live-caller, live-caller polls are well represented in RealClearPolitics and other polling averages. One percent may be considered a small amount, but it is not nothing, and it is statistically significant. The small size might be taken as vindication by those who dismiss the Shy Trump Effect, and the statistical significance as vindication by who swear by it.
The variable “Democratic Skew” is equal to the difference in the percent of a poll comprising self-identified Democrats less the percent comprising self-identified Republicans, relative to the jurisdiction’s Democratic margin as was determined in calculating “Partisan Affiliation.” The partisan composition of a poll might be directly pegged by a poll-taking organization, or heavily influenced by the demographics by which the sample is weighted6. When pegged by a poll-taking organization, or heavily influenced by the poll’s weighting scheme, the poll’s results reflect the pollster’s turnout model for the election. By measuring the difference of each poll’s partisan composition relative to a common assumption, the regression is able to determine the extent to which polls relatively rich in Democrats tend to favor the Democratic candidate.
According to the 2020 Exit Poll, the Democrats had a 1-point advantage over the Republicans in the actual vote. In retrospect, this was only known after the election. U.S. elections are famously low turnout and the 2020 election featured a lot of uncertainty about turnout.
In fact, voter participation increased in 2020 relative to 2016, in part due to the liberalization of absentee voting in certain places. Jesse Yoder, et. al [23] found that voter participation increased by 4.8 percentage points in states that did not liberalize absentee voting and by a slightly higher 5.6 percentage points in states that did. They interpret the slight difference to mean the surge in voter participation was mostly due to increased voter enthusiasm, rather than to liberalization of voting. Abramowitz [24], looking at state data, and Amlani and Collet [25], looking at county data, find no evidence that increased turnout favored Biden.
Modelling turnout is a big part of poll-taking. Based on various sources of information available in real-time, this study put the Democratic advantage at 2 points. In comparison, the average Democratic advantage in the pre-election polls was 4 points.
The coefficient of the variable “Democratic Skew” represents the effect on Biden’s margin per percentage point of how relatively rich in Democrats is a poll. At 0.5, this effect is sizeable. Given that the polls overstated the Democratic advantage in turnout by 2 points relative to the assumption used in this study, the coefficient of “Democratic Skew” implies that about 1 point of the difference between Biden’s margin in the polls and his actual margin was due to turnout models that were overly rich in Democrats. Given that the polls overstated the Democratic advantage in turnout by 3 points relative to the Exit Poll, the coefficient of “Democratic Skew” implies that 1.5 points of Biden’s surprisingly narrow margin of victory was due to incorrect turnout models.
The variable “Poll-taker Bias” represents the tendency of particular polls to favor Biden or to favor Trump relative to the reference set of polls. These tendencies are expressed in Tables 3 and 4 as D+8, D+7, … D+1, ---, R+1, … R+7, R+8. Certain poll-taking organizations were put into residual groups, among these being Miscellaneous Democratic, Republican and Non-partisan polls, with ratings determined at the group level. Miscellaneous Democratic polls favored Biden relative to the reference set of polls (D+4), Miscellaneous Republican polls were neutral (---), and Miscellaneous Non-partisan polls were in between (D+1).
The partisan ratings of the big media polls were mostly D+2 or D+3. CNN/SSRS and Trafalgar were D+4 and R+4, which might be considered borderline credible. The polls averaged a rating of D+2, meaning that another important explanation of the difference between Biden’s margin in the polls and his actual margin was poll-taker bias.
To summarize, live-caller polls (about a quarter of the polls in this study) were biased by about 1 point, over-representation of Democrats contributed a bias of 1 or 1.5 points, and polls averaged 2 points of bias independent of live-caller and sample composition, relative to a reference set of polls.
Discussion
Analysis of more than 1600 polls conducted during the 2020 Presidential Election indicates that Biden’s margin in the polls exceeded his actual margin for three reasons: poll-specific bias, overly-Democratic samples, and live-caller bias. Where prior work had only ruled-out certain possible causes, and had not identified the causes of the error, this work uses multi-variate analysis to break down the error to its components.
Live-caller bias is almost certainly due to Shy Trumpers. The inability of poll-taking organizations to get the partisan composition of the vote correct might be due to some combination of Shy Trumpers and late-deciders, and the difficulty of modeling turnout in an election featuring a lot of uncertainty concerning voter turnout.
Poll-specific bias has the potential to flip the narrative of the polls being biased from Trumpers to Pollsters. What has sometimes been described as herding among poll-taking organizations may reflect a desire on the part of poll-taking organizations to appeal to the readers and advertisers of the media that sponsor them and also to maintain relations with their associates in the industry and – in the case of polls conducted by academic institutions – their colleagues in the academy.
The problem of polling bias in the U.S. might be rooted in something deeper than social desirability bias, viz., the degree of polarization taking place as modulated by winner-takes-all elections, and perhaps also as modulated by a particular candidate.
Competing Interests:
The authors declare she has no competing interests.
References
Druke, G. & Silver, N. (2020). Politics Podcast: There just isn’t good evidence that ‘shy’ Trump voters exist. Fivethirtyeight, 30 Oct.View
Stanton, Z. (2020).‘People are going to be shocked’: Return of the ‘shy’ Trump voter. Politico, 29 Oct.View
Hopkins, D. (2009). No more Wilder effect, never a Whitman effect: When and why polls mislead about black and female candidates. Journal of Politics, 71(3), 769-78.View
Kline, R., & Stout, C. (2009). Measuring Polling Bias in 2008: The Bradley Effect and Related Issues. Center for the Study of Democracy, April 27.View
Stromberg, D. (2008). How Large is the Bradley Effect and Does it Matter for Obama? Vox, 3 Nov.View
Bishop, G.F., & Fisher, B.S. (1995). ’Secret ballots’ and self reports in an exit-poll experiment. Public Opinion Quarterly, 59(4), 568-88.View
Kreuter, F., Presser, S., & Tourangeau, R. (2008). Social Desirability bias in CATI, IVR and Web Surveys. Public Opinion Quarterly, 72(5), 847-65. View
Jowell, R., Hedges, B., Lynn, P., Farrant, G. & Heath, A. (1993). The 1992 British Election: The Failure of the Polls. Public Opinion Quarterly, 57(2), 238-63.View
Sturgis, P., Baker, N., Callegaro, M., Fisher, S., Green, J., Jennings, W., Kuha, J., Lauderdale, B., & Smith, P. (2016). Report of the Inquiry into the 2015 British general election opinion polls. London: Market Research Society and British Polling Council, Mar.View
Dropp, K.A. (2015). Why does Donald Trump perform better in online versus live telephone polling? Morning Consult, 21 Dec.View
Brownback, A., & Novotny, A. (2018). Social desirability bias and polling errors in the 2016 presidential election. Journal of Behavioral and Experimental Economics, 74, 38-56. View
Claassen, R.L., & Ryan, J.B. (2016). Social desirability, hidden biases and support for Hillary Clinton. PS, Political Science and Politics, 49(4), 730-35.View
Coppock, A. (2017). Did shy Trump supporters bias the 2016 Polls? Evidence from a Nationally-representative list experiment. Statistics, Politics, and Policy, 8(1), 29-40. View
Patrick, W.L. (2016). Stealth voters facilitate Trump’s poll vault to victory. Psychology Today, 10 Nov.View
Prosser, C., & Mellon, J. (2018). The Twilight of the Polls? A Review of Trends in Polling Accuracy and the Causes of Polling Misses. Government and Opposition 53(4): 1-34.View
Thies, C.F. (2018). The Chicago Record Poll and the Election of 1896. Presidential Studies Quarterly 48(1): 127-138.View
AAPOR [American Association of Public Opinion Research] (2017). An Evaluation of 2016 Election Polls in the U.S. View
AAPOR [American Association of Public Opinion Research] (2021). An Evaluation of the 2020 General Election Polls.View
Clinton, J., Lapinski, J.S., & Trussler, M.J. (2022). Reluctant Republicans, Eager Democrats? Partisan Nonresponse and the Accuracy of 2020 Presidential Pre-election Telephone Polls. Public Opinion Quarterly 86:2 (Summer): 247-69. View
McKinley, S.P., Arem, Z.S., & Smith, A.E. (2020). Silent Voters? Many Trump supporters feel need to hide their support. University of New Hampshire, 19 Oct. View
Elkins, E. (2020). Poll: 62% of Americans say they have political views they’re afraid to share. Cato Institute, 22 Jul.View
Sabato, L.J., Kondik, K., & Coleman, J.M. (2021). New Initiative Explores Deep, Persistent Divides Between Biden and Trump Voters. University of Virginia Center for Politics. 30 Sep.View
Yoder, Y., Handan-Nader, C., Myers, A., Nowacki, T., Thompson, D.M., Wu, J.A., Yorgason, C., & Hall, A.B.. (2021). How did absentee voting affect the 2020 U.S. election? Science Advances 7(52).View
Abramowitz, A.I. (2021). Assessing the impact of absentee voting on turnout and Democratic margin in 2020. Center for Politics.View
Amlani, S., & Collit, C. (2022). The impact of vote-by mail policy on turnout and vote share in the 2020 election. Election Law Journal, Rules, and Policy, 21:2 (June): 135-149. View