
- About the Journal
- Editorial Board
- Review Process
- Author Guidelines
- Article Processing Charges
- Special Issues
- Current Issue
- Past Issue
 Journal of Political Science and Public Opinion
Journal of Political Science and Public Opinion Volume 3 (2025), Article ID: JPSPO-126
https://doi.org/10.33790/jpspo1100126Research Article
An Analysis of the U.S. 2024 Polls
Clifford F. Thies
Professor of Economics and Finance, Shenandoah University, 1460 University Drive, Winchester, VA 22601 United States.
Corresponding Author: Clifford F. Thies, Professor of Economics and Finance, Shenandoah University, 1460 University Drive, Winchester, VA 22601 United States.
Received date: 27th May, 2025
Accepted date: 06th August, 2025
Published date: 08th August, 2025
Citation: Thies, C. F., (2025). An Analysis of the U.S. 2024 Polls. J Poli Sci Publi Opin, 3(2): 126.
Copyright: ©2025, This is an open-access article distributed under the terms of the Creative Commons Attribution License, which permits unrestricted use, distribution, and reproduction in any medium, provided the original author and source are credited
Abstract
In 2024, for the third U.S. Presidential election in a row, the polls under-predicted Donald Trump’s performance. In 2016, Trump won a surprising victory, winning several midwestern states he was tabbed to lose. In 2020, Trump lost by a surprisingly close margin in an election he was supposed to lose badly. In 2024, the polls pointed to a narrow loss by Trump, when he won by a narrow margin. In an analysis of the polls of 2020 in this journal [1], I showed that the miscall of the 2020 election could be attributed to (1) polls that were too rich in Democrats, (2) Shy Trumpers and (3) poll-specific bias. In this paper, I look at the polls of 2024.
Background
The United States of America, like the United Kingdom, Canada and India, conducts elections by the first past the post method1. That is, the candidate that finishes in first-place in any given jurisdiction wins. In the U.K., Canada and India, parliamentary democracies, there are several strong nationwide parties, yet other strong regional parties, and many jurisdictions. In Canada, there are 338 districts, in India 543, and the U.K. 650. In India, not only are there many districts, the districts are enormous. In India, it’s not unusual for polls to be massive by American standards. In the U.S., there usually are only two meaningful candidates, and the number of jurisdictions is only 51 (the 50 states and the District of Columbia). As a result, polls tend to be small. The main problem with polls in the U.S. isn’t size (or, sampling error), but is bias. This bias problem is especially important nowadays when polls rely on convenience samples and on post-survey weighting to make their samples representative of the presumed population of voters. Deviations of the presumed population from the actual population can make big differences in the findings of polls.
The classic example of the difference between sampling error and bias is the Literary Digest Poll. In 1936, the Literary Digest, a weekly magazine, distributed 10 million surveys by mail, and received 2.3 million responses. Unfortunately, the surveys were distributed to lists of automobile owners and subscribers to telephone service. These lists were not representative of the population of voters. In addition, there is evidence of non-response bias in the 1936 Literary Digest Poll even among automobile owners and subscribers to telephone service. As a result of bias, the finding of the poll – that Republican Alf Landon would win the Presidential election in a landslide – wasn’t credible. In contrast, the much smaller but scientific poll conducted by George H. Gallup called the election correctly; specifically, that Democrat Franklin D. Roosevelt would be re-elected by a substantial margin [2].
Back in the 1930s, Gallup and other scientific polling organizations conducted their polls face-to-face using clustered random sampling. By the 1950s, most polls were conducted via telephone using live callers. For a time, there was near universal (land-line) phone service in the country, and most people were willing to be interviewed. This was the golden age of public opinion surveys. However, things changed. Cell phones substituted for land-line phones, and many people came to resist being interviewed. New polling technologies were developed, such as assembling panels of respondents, in some cases, with remuneration for completing surveys [3]. Following the 2016 election, the polling industry attributed the miscall to insufficient post-survey weighting; specifically, not weighting the sample for education [4]. Following the 2020 election, the polling industry was simply perplexed [5].
During the 2024 election, polls and polling aggregators showing results contrary to strongly-held expectations were routinely denounced and even suppressed. The granddaddy of polling aggregators – Real Clear Politics – was removed from the Wikipedia entry on polling aggregators, only to be restored after the election when it proved to be second least inaccurate in two-way poll aggregation and least inaccurate in multi-candidate poll aggregation [6]. See Table 1.
After the election, the polling aggregator 538 (sometimes stated as FiveThirtyEight) – one of the most inaccurate aggregators – was terminated in a cost-cutting move by ABC-Disney [7]; and, Monmouth University Polling Institute was shut down [8]. The highly-regarded pollster Ann Selzer retired after a 16-point miss in a poll of the state of Iowa [9]. Missing by 17 points were two polls of the state of New Hampshire conducted by Dartmouth College. While Kamala Harris won the state of New Hampshire by 3 percentage points, both in mid-October and in early-November, this poll said she would win the state by 20 percentage points [10].
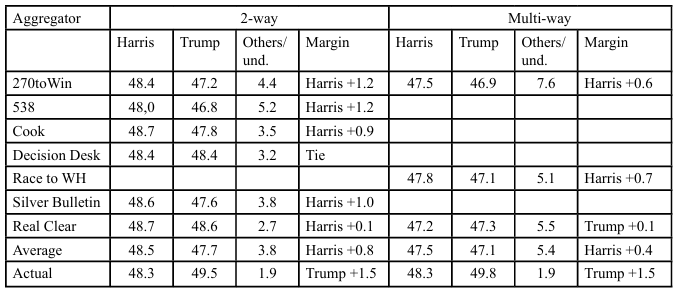
Table 1. Wikipedia entries for polling aggregators in the 2024 election after Real Clear Politics was restored
Among the more accurate polls were those conducted by Atlas Intelligence. This Brazilian company has an impressive record of polling elections in western democracies. Few other polls showed Trump with an advantage, and many that did were associated to some degree with the Republican Party. While some polls showed Trump ahead, as shown by the polling aggregators in Table 1, the polling average immediately prior to the election showed the Democrat to be ahead.
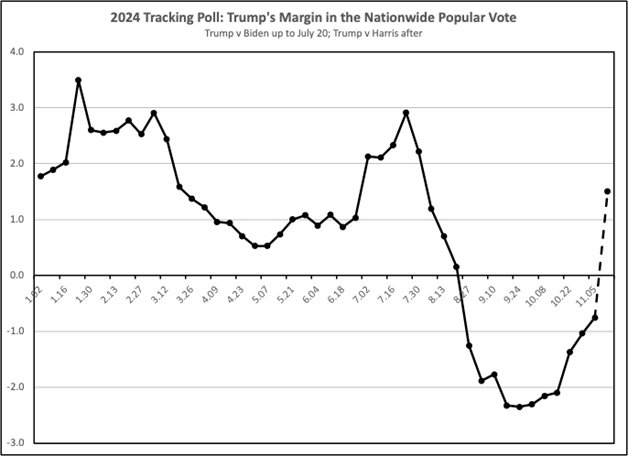
Figure 1
Tracking the Polls
Figure 1 tracks the polls through 2024. The figure reflects all nationwide polls included in the 538 website. Entries are rolling four-week averages, with polls weighted by size. Because of the possibility of bias, the chart should merely be considered to be an index of voting intentions.
The figure indicates that Trump entered the year as a slight favorite. The picture changed dramatically following President Joe Biden’s disastrous performance in the June debate [11,12]. Trump’s lead jumped, and Biden was persuaded to withdraw.
Vice President Kamala Harris was then nominated for President by the Democratic Party. She proceeded to take the lead in the race. To some extent, her lead was transitory, part of a “honeymoon” period [13]. During the final weeks of the campaign, the race tightened. As indicated in Figure 1, and by the average of the polling aggregators in Table 1, Harris entered election day with only a slight lead in the polls. Then, upon the tabulation of the vote, Trump won the nationwide popular vote by a small but decisive margin. There is a clear discontinuity between the final polling average and the actual vote. Given that the combined sample in the polling aggregate is several lakh, the discontinuity cannot simply be attributed to sampling error.
A similar picture emerges with state polls. Figure 2 tracks the Electoral College, not the popular vote. Winning the U.S. Presidential election involves finishing first in states with at least 269 Electoral College Votes2. In close elections, the outcome is determined in a slowly-evolving set of states characterized as “Battleground States.” Each of the Battleground States was polled frequently. Many other states were polled frequently enough. Some states – generally small, non-Battleground States – were seldom polled, and are modeled primarily with alternate information.
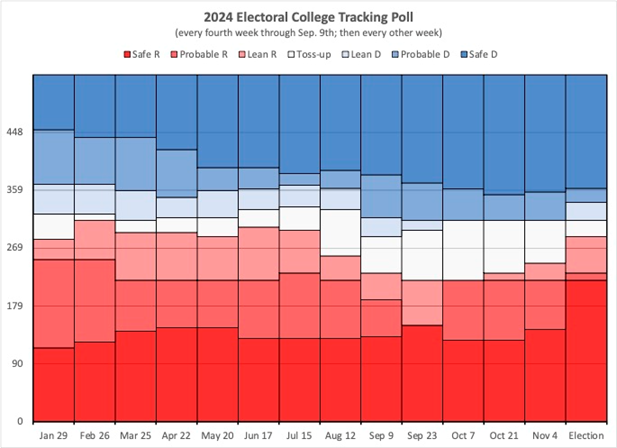
Figure 2
In the set of tracking polls reflected in Figure 2, state averages are four-week moving averages, with polls weighted by size, for states that are polled frequently. For states that are polled less frequently, state averages involve the most recent polls totaling at least 4,000 respondents. For states that are infrequently polled, a variety of information is used to infer voter intentions.
Through June 17th, a state is said to be a toss-up if neither candidate leads by at least 2 percentage points. If the leading candidate is ahead by at least 2 and by less than 6 percentage points, the state is said to lean toward that candidate. If the leading candidate is ahead by at least 6 and by less than 10 percentage points, the state is said to be probable for that candidate. And, if the leading candidate is ahead by at least 10 percentage points, the state is said to be safe for that candidate. These parameters are gradually tightened after June 17th as shown in the following table.
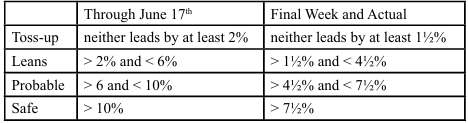
Table 2. Classification of States by lead in the polls
Consistent with the nationwide polls, the state polls show that Trump began the year with leads in states with enough Electoral College Votes for him to win the election. Again, as with the nationwide polls, the picture changed when the Democrats shifted from Biden to Harris. Except, the state polls indicate that at no time was Harris a clear favorite. Beginning in August, toss-up states straddle 269 Electoral College Votes. Even though Harris was leading in the polls of the nationwide popular vote, the state polls indicated that the election would be determined in the relatively few Battleground States. A 2016-like result, in which the winner of the nationwide popular vote loses in the Electoral College, looked to be a real possibility.
When the votes were tabulated, Trump won all of the Battleground States, most relatively easily. Two – Michigan and Wisconsin – were close, and are shown as toss-ups (white) in Figure 2. In addition, Trump threatened several states that had been thought to be probable for Harris. The Electoral College votes of these states are shown as Leans Democrats (light blue) in Figure 2.
Exit Polls
According to the 2024 Exit Poll conducted by Edison Research on behalf of ABC, CBS, CNN and NBC, late deciders broke heavily for Trump. Late deciders, though small in number (6 percent of voters) can explain part of the polling miscall. Among voters that made up their minds prior to September (80 percent of voters), Trump led by 1 percentage point. Among those that made up their minds in September or October (11 percent of voters), Harris led by 6 percentage points. These findings are consistent with polls showing Trump with the lead at the start of the year, and Harris pulling out to the lead after she was nominated by the Democratic Party. However, among voters that made up their mind in November, Trump lead by 9 percentage points. These late deciders might not have been fully reflected in the polling average of the final week of the campaign.
Late-deciders were instrumental in Trump’s surprising victory in 2016. According to the Exit Poll, of voters whose minds were made up before September, 52 percent favored Clinton versus 45 percent for Trump. September was close to break-even. Then, in October, 51 percent of those who made up their mind favored Trump, versus 37 percent for Clinton. Late-deciders were clearly a part of the 2016 election; but not so much of the 2020 election.
According to both the Edison Research Exit Poll and the Voter Analysis conducted by NORC (formerly the National Opinion Research Center) on behalf of the AP and Fox, Republicans had an advantage of 4 percentage points in the party affiliation of voters in 2024. In the prior two elections, it had been the Democrats who enjoyed the advantage in party affiliation. Polling organizations that weighted their samples by party affiliation based on the prior election put bias into their polls.
There is a lot of information indicating that Republicans have narrowed or even eliminated the advantage of Democrats in party affiliation. According to the Gallup Poll, which includes party affiliation in its monthly omnibus survey, party affiliation has been trending Republican [14]. In 2016 and 2020, Democrats held a 5 percentage point advantage over Republicans in party affiliation; and, in 2024, Republicans held a 1 percentage point advantage over Democrats.
Thirty-one states and the District of Columbia register voters by party [15]. Party registration, as distinct from party affiliation, is very slow-changing. However, party registration figures encompass the entire population of voters, not merely a sample. In 2016, Democrats had an advantage over Republicans of 11 percentage points in party registration. This advantage fell to 10 percentage points in 2020, and to 8 percentage points in 2024. Polling organizations that weight by party affiliation can do a better job than merely weight their samples by party affiliation in the prior election.
Turnout
With political parties in the United States increasingly defined by ideology, elections have become more about parties turning out their low-propensity voters, than about candidates appealing to cross over and independent voters [16-18]3. Historically, Democrats were thought to be the beneficiaries of high turnout. This appears no longer the case.
Ronald Brownstein [19], merging three NBC polls, found that Biden led Trump by 4 percentage polls among those who had voted in both 2020 and 2022. Contrariwise, among those who had voted in 2020 but not in 2022, Trump led Biden by 12 percentage points. Dan Hopkins [20], examining a survey of citizens at least 23 years old, found a strong inverse correlation between the number of federal elections in which a person voted, and support for Trump. Specifically, those who had voted in all three prior federal elections favored Biden by 11 percentage points, and those who had voted in none of those elections favored Trump by 18 points. This finding held for persons identifying as white, black and Hispanic; and dramatically so among those identifying as black. Motta, Trujillo, et al. [21] have examined whether Biden’s dropping out of the race was driven by turnout considerations.
In all three of his elections, Trump relied on personal charm, relentless campaigning and massive, party-like rallies to boost turnout. In 2020, Democrats used relaxed protocols for processing mail ballots to gain the advantage in turnout. In 2024, while the switch from Biden to Harris gave the Democrats some momentum, Trump’s survival of an assassination attempt may have been the deciding factor. In American elections, which are notoriously low turnout by the standards of other democracies, polling organizations have to forecast turnout and not merely presume in their weighting scheme that the next election will be characterized by the turnout model of the prior election.
Competing Interest:
The authors of this research declare no competing interest regarding this study.
References
Clifford F. Thies, (2023). “Shy Trumpers and Live Callers: An Analysis of the U.S. 2020 Polls.” Journal of Political Science and Public Opinion, 1: 1-6. View
Peverill Squire, (1988). “Why the 1936 Literary Digest Poll Failed.” Public Opinion Quarterly, 52: 125-133. View
D. Sunshine Hillygus, (2011). “The Evolution of Election Polling in the United States.” Public Opinion Quarterly 75:5: 962-981. View
AAPOR (American Association of Public Opinion Research), “An Evaluation of 2016 Election Polls in the U.S.,” 2017. View
AAPOR (American Association of Public Opinion Research), “An Evaluation of the 2020 General Election Polls in the U.S.,” 2021.
Matt Tiabbi, (2024). “How America’s Accurate Election Polls Were Covered Up.” racket.news, November, 15. View
Kelby Vera, (2025). “Political Number Cruncher FiveThirtyEight to be Shuttered Amid Disney Layoffs.” HuffPost.com, March 5. View
Rob Jennings, (2025). “End of an era in N.J. politics as nationally-known polling operation shuts down.” nj.com, March 15. View
Liam Reilly, (2024). “Ann Selzer to end election polling after 16-point miss in final Iowa survey.” CNN.com, November 17. View
Amy Olson, (2024). “The Dartmouth Poll Shows Democrats Continue to Lead in Top Races,” Dartmouth.edu, November 4. View
Stephen Collinson, (2024). “Biden’s disastrous debate pitches his reelection bid into crisis.” CNN.com, June 28. View
Jake Tapper and Alex Thompson, (2025). “Original Sin: President Biden's Decline, Its Cover-Up, and His Disastrous Choice to Run Again.” Penguin Press. View
Eli Stokols, Adam Cancryn and Lisa Kashinsky, (2024). “‘The honeymoon’s inevitably going to end’: Harris dives into a critical stretch of the election,” politico.com, August 23. View
Sarah Fortinsky, (2025). “GOP again holds edge in party affiliations: Survey.” thehill.com, January 16. View
Ballot Access News, (2024). “Voter Registration Totals.” November. View
Delia Baldassarri and Peter Bearman. (2007). “Dynamics of Political Polarization.” American Sociological Review 72:5 (October): 784-811 View
Steven Callander and Catherine H. Wilson, (2007). “Turnout, Polarization and Duverger’s Law.” Journal of Politics 69:4: 1047-1056. View
Kyle L. Saunders and Alan I. Abramowitz. (2004). “Ideological Realignment and Active Partisans in the American Electorate.” American Politics Research 32:3: 285–309. View
Ronald Brownstein, “The unusual turnout dynamic that could decide the 2024 election.” CNN.com, May 29, 2004. View
Dan Hopkins, (2024). “The less you vote, the more you back Trump.” abcnews.go.com, April 10. View
Matt Motta, Kristin Lunz Trujillo, Dominik Stecuda, Timothy Callaghan, Yotam Ophir and Dror Walter, (2024). “Quantifying the Electoral ‘Vibe Shift.’ A Naturally-Occurring Experiment on President Biden’s Decision to Exit the 2024 Presidential Race.” View