
- About the Journal
- Editorial Board
- Review Process
- Author Guidelines
- Article Processing Charges
- Special Issues
- Indexing
- Current Issue
- Past Issue
 Journal of Public Health Issues and Practices
Journal of Public Health Issues and Practices Volume 2 (2018), Article ID: JPHIP-121
https://doi.org/10.33790/jphip1100121Research Article
Source of Stress in Sport: A Rasch Calibration
Christine Williams1*, Ramona Stone1, Seungho Ryu2
1Department of Health, 304 Sturzebecker Health Sciences, West Chester University, 855 S. New Street, West Chester, PA 19383, USA.
2Doctoral Student, Graduate Teaching Assistant Middle Tennessee State University Department of Health and Human Performance 1500 Greenland Drive, P.O. Box 96 Murfreesboro, TN 37132 Kinesmetrics Lab, Murphy Center 126 USA.
Corresponding Author Details: Christine Williams, Ph.D., CHES, Associate Professor, Department of Health, West Chester University, 855 S. New Street, West Chester, PA 19383, USA. E-mail: Cwilliams3@wcupa.edu
Received date: 19th March, 2018
Accepted date: 20th August, 2018
Published date: 11st October, 2018
Citation: Williams C, Stone R, Ryu S (2018) Source of Stress in sport: A Rasch Calibration. J Pub Health Issue Pract 2: 121.
Copyright: ©2018, This is an open-access article distributed under the terms of the Creative Commons Attribution License, which permits unrestricted use, distribution, and reproduction in any medium, provided the original author and source are credited
Abstract
The purpose of this study was to assess the psychometric properties of a stress in sport inventory by determining optimal categorization and model-data fit, and calibrate the sources of stress items associated with individual and team sport athletes using Rasch modeling. The study examines the intensity level of various sources of acute stress experienced by competitive athletes. The Sources of Stress in Sport Inventory (SSSI) was generated to measure intensity level of perceived stress in sport. A total of 336 college-aged males (N=167) and females (N=169) who previously competed in high school or college sports participated. Function of the rating scale was tested to determine if the 5 original rating scale categories were the best fit. Intensity levels of stress items for the athletes were analyzed. The existing 5 rating scale categories functioned well. The top three items of intense acute stress were making a physical or mental error (logits= -0.56), being injured and playing in pain (logits= -0.35), and receiving a "bad" or "unfair" call from the referee/umpire (logits= -0.25). Results support SSSI as an effective scale assessing acute stress in sport among college students. Researchers must continue to understand the sources of stress in sport among athletes using effective inventories so that coaches and health educators can address effective coping and stress management mechanisms and healthy behavioral changes.
Problem Statement
Stress is the reaction to a person’s appraisal process, which consists of assessing whether personal resources can accommodate environmental demands [1]. Stress causes a negative emotional reaction that may include cognitive, behavioral, physiological, and biochemical changes that are meant to alter the stressful event or accommodate the effects [2]. Reactions to stress are important due to the positive relationship between stress, accidents [3], and performance errors [4]. Individuals differ in reactions to stressful events but stress is an inevitable experience in life and is particularly prevalent in competitive sports that can vary by intensity.
Stress varies in duration from acute to chronic [5]. Acute stress is the immediate response to a sudden event a person appraises as stressful, while chronic stress occurs over a long period of time. Failure to cope properly with acute stress may result in experiencing chronic stress [5]. An example of poor coping experienced in competitive sport includes failure to ignore a situation that is beyond the athlete’s control [6].
Examples of acute stress include making mental and physical errors, receiving a “bad” call from the referee or umpire, a reprimand from the coach, experiencing pain or injury, and negative communication from spectators and opponents [7]. Acute stress varies not only by type of stressor, but also by skill level [8]. Acute stressors experienced by elite athletes include unpleasant interactions with coaches, receiving a “bad” call from the referee, and making an error. Nicholls et al. [9] compared international athletes with national, county, university and club competitive teams on stress as a function of skill. Researchers indicated that international athletes reported less concern about letting down teammates, as compared to their less-skilled counterparts. Acute stressors exist at all skill levels but source of stress may vary by type.
Various types of acute stressors can be experienced as a function of situational demands. For example, Nicholls AR, et al. [10] found that professional rugby players encountered different types of stressors during practice, as compared to stress experienced during games. The researchers also found that players perceived more intense stress during training sessions than during games with respect to coach criticism, mental and physical errors, injury, confusion on drills and poor playing weather conditions. During games, however, the players felt greater stress from opponents’ performance success, cheating opponents, receiving a “bad” call from an official, and being distracted by the crowd. The stressors from practice were selfgenerated (e.g., making mistakes, trying to understand directions) and externally-generated (e.g., opponent success, coach reprimand, “bad” call from the referee). Game-related sources were more likely to be externally-based (e.g., crowd behavior, coach’s reactions). Players may feel less distracted toward their surroundings during practice, and more inclined to reflect on cognitive and emotional issues involving internal demands [10].
Holt conducted a qualitative study examining sources of stress with a professional English cricket player (2003). The athlete’s stress appraisals, defined as the athlete’s reaction to stimuli as stressful, were based on fear of endangerment to the athlete’s performance goals. The most intense stress or was not meeting personal goals. Perception of failing to meet personal performance goals was interpreted as negatively impacting his professional athletic career and future income. Internal goals created the highest perceived stress for this athlete, but external stress sources may cause high perceived stress among other athletes. Another common source of sport stress is the coach. Actions by coaches that are unpredictable and unfamiliar While international and domestic athletes report stress due to coaches and training, stressors vary by sport. Golfers were the most affected by stress of poor playing weather conditions, observing opponents playing well, and committing physical or mental errors [5]. These stressors accounted for 75% of the overall stress experienced. Team sports have been found to have specific stressors related to the skill of the athlete [9]. Stressors not only vary by sport but by intensity level as well.
Stress intensity is most important when researching sources of stress. Anshel and Sutarso [16], for example, found that stressor intensity was associated with coping style. Nicholls, et al. [17] studied stress intensity levels among international cross country runners. Researchers found stress intensity peaked on competition days, as compare to training days. Their results indicated that stressor intensity increased when stakes were higher. Stressors on competition days included outcome, ability, environment and technique/tactics.
By analyzing various intensity levels of acute stressors across several types of sport, researchers have a greater base of knowledge from which to improve athlete’s stress levels. This study offers a unique component to the body of literature on stress and athletes by analyzing the sources of stress in sport and presenting further information about perceived stress intensity levels among athletes. A better understanding about acute sources of stress will allow researchers to develop stress management interventions among athletes to improve perceived stress intensity levels and coping skills for stress. Acute sources of stress in sport have not been addressed using a Rasch model analysis.
Background on Rasch Model
The Rasch model [18,19] is an advanced measurement approach that addresses some psychometric limitations of the traditional measurement theory methods, such as sample- and item- dependent. A main advantage of Rasch analysis is the parameter invariability component. Items in a scale and participant responses are measured mutually exclusively using a common metric. Analysis results in examining the relative positions of items and persons along the common metric. Parameter invariance allows for calibration results to be generalizable between data sets. Rasch analysis is unidimensional and offers the ability to determine how well a scale functions and how well an individual functions on the scale.
Compared to traditional measurement work, Rasch analysis provides better evaluation of the items and a more precise measurement of the scale. Rasch analysis indicates the most and least difficult items and the highest and lowest participant ability levels. Item and person estimates are calculated during the calibration process. Statistics calculated determine how well the scores and items are distributed along the scale and reliability of these findings. Gaps along the measurement scale for items may indicate a need for more items in the scale. Rasch analysis can expose inadequacies of a scale so that researchers may improve scale accuracy.
Rasch analysis addresses limitations of traditional measurement and statistical methods [20-23]. Standard methodologies for analyzing Likert-type scale data omit participant response subjectivity and assume each participant has identical connotations of the item responses. Rasch analysis allows for the difficulty of each item to be based on the way participants respond to the item in actual practice. The analysis measures the overall response difficulty per participant and ranks participants on difficulty level. The Rasch model also examines optimal categorization through evaluation and reconstruction of categories [24].
Rasch analysis offers testing function of the rating scale categories. The Rasch analysis results provided by calibration offer a thorough portrayal of the data. Optimal categorization allows for evaluation of the intended category, verifying the perceptions of respondents of the ordering of category meanings and if needed, offers a guide to reconstructing the categories [24]. In one study by Zhu, Timm and Ainsworth, the results from optimal categorization indicated a need to collapse a scale from five categories to three categories (2001) [25]. By changing the categories, the scale becomes more efficient and increases the accuracy of the resulting measure.
A Rasch analysis is unique for studying types of stress in sport and has been shown to be an informative type of analysis. More research is needed to exam sources of acute sport stress using the Rasch model to determine the greatest sources of acute stress and to have a more precise measurement scale.
Study Objectives
The purpose of this study was to assess acute sources of stress among athletes using the Rasch Model design and to validate the 16 items of the scale using a sample of 336 students.
Methods
Participants
This sample consisted of 336 students (males = 167 and females = 169) with an average age of 23.54 (SD = 5.31) years. Participants competed in organized sport for their high school, college or a recreational or affiliated team and were currently attending a southeastern U.S. university. Participants competed in team sports (n = 262, 78%) or individual sports (n = 71, 21.1%), and ethnicities included African American (n= 121, 36%), Caucasian (n = 202, 60.1%), Hispanic (n= 8, 2.4%), Asian (n= 2, 0.6%), or “other” 0.6%. Informed consent was obtained from all 336 individual participants included in the study. If participants scored more than one response per item, their response was removed. This occurred on 21 responses out of the total 5376 responses.
Materials
The Sources of Stress in Sport Inventory (SSSI) used in this study was derived from Sources of Acute Stress (SAS) developed by Anshel et al. [26] and Puente-Diaz et al. [27]. Sample sources of acute stress include arguing with a teammate or making a physical or mental error. SSSI measures the perceived level of stress in a sport setting experienced by athletes. The inventory consists of sixteen items with a 5-point Likert rating scale ranging from 1 (not at all) to 5 (extremely). Four additional demographic questions are included in the inventory: gender, age, sport type, and race. Reliability and validity of the scale was analyzed.
Data Analysis
A two-facet Rasch model was estimated, including the item (sources of stress) and person (perceived stress intensity level) parameters. The Winsteps v3.65, Rasch measurement computer program, was used to examine the perceived level of intensity for stressful events in sport for college students. SPSS v16 was used to compute the descriptive data, as applicable. The Rasch analysis consisted of 6 analytical steps.
(1) The function of the rating scale was tested to determine if the existing instrument category (i.e., five categories) was the fit for the inventory. The evaluation criteria included: (a) Were there at least ten observations per category? (b) What is the shape of the distribution of scores: unimodal, bimodal, skewed or slightly skewed? (c) Was there an increase in the average logit score measure with the increase on the scale? (d) Was the Outfit mean square residual appropriate for each category (Outfit statistics < 2.0)? (e) Were the category thresholds (i.e. boundaries between categories) ordered? [28].
(2) Model-data fit was then analyzed to determine how well the data fits the model by examining Infit and Outfit statistics [28]. The Infit measures indicate the residuals, or the difference between the observed and expected responses. Outfit measures are similar to the Infit statistics, but they are more sensitive to outliers. In fit and Outfit measurements with a value closer to 1 indicate a satisfactory modeldata fit. If the Infit and Outfit statistics are less than 0.5 or greater than 1.5, they should be considered misfits [27]. Infit and Outfit valuesless than 0.5 indicate little variation while the values greater than 1.5 show inconsistent response.
(3) The estimates for the sources of stress items were calculated during the calibration process; the higher the logit score for sources of stress, the less stressful the item is perceived by players. The item separation index was calculated to determine how well the scores and items were distributed along the measurement scale (separation index > 2.0[21]. The item separation reliability was calculated to learn if it’s possible to replicate these item placements along the pathway with the same questions implemented with another random sample (reliability scores close to 1.00 denote high confidence, [29].
(4) The persons perceived stress intensity level was estimated by the logit score; the higher the logit score the higher the perceived level of stress. Person separation index and person separation reliability were also calculated. The person separation index indicates how well people are spread along the measurement scale (separation index > 2.0, [21]. The reliability scores that are close to 1.00 indicate high consistency [29] and show that it is plausible to expect consistency among similar populations.
(5) An item-person map distribution was developed and examined. The item-person map visually describes both person and item logit scores along the same numerical scale to allow comparison of the two measures. The map shows each person’s perceived stress intensity level, the difficulty level for each stress item, and the relative position of person’s perceived stress intensity for the various sources of stress items in logits.
Results
Reliability and Validity
IBM SPSS 24.0 was used to test the measurement reliability and validity; specifically, reliability analysis and factor analysis procedures were used to establish reliability and content validity. The 16-item scale had an average of 45.2 with a standard deviation of 11.3. Cronbach’s α (α=.869) indicated a very good scale reliability, a relatively high internal consistency. Moreover, while content validity was greatly established during the development of the items, a Cronbach’s α of this size is also supportive of the assumption that the items measure a common latent concept. Finally, the average corrected item-total correlations (CITC) was 0.502, with the 16 items varying between .294 and .590, provided the empirical evidence that the items are measuring the same construct.
Using a principal axis factoring (PFA) with Oblimin rotation with Kaiser normalization, and a threshold for salience set to .30, three components were extracted; altogether they explained 54.18% of the variance in the 16-item scale, with the first factor accounting for 36.06%. The sampling adequacy coefficient KMO= .876 showed that the data was suited for the factor analysis, and that a significant amount of scale variance may be caused by underlying factors. Moreover, the Bartlett’s test of Sphericity χ2(105)=1588.5 (p<.001) confirmed that the correlation matrix was significantly different from the identity matrix, and that the variables are indeed related. Item 8 and 13 had a loading below .30, suggesting that they could be dropped from the scale. Once these two items were excluded, a third item (SS7) loading decreased below .30, and was also taken out. Finally, the reliability coefficient for the scale that excluded items SS7, SS8, and SS13, was α=.838. Altogether, the three extracted factors explained 58.74% of the variance in the 13 items, with a Bartlett’s test of Sphericity χ2(66)=1214.023 (p<.001). To conclude, the data shows that the SSI scale has a very good reliability and high content validity.
Rating scale functioning
Table 1 displays the summary of the 5-category rating scale function of the SSSI. Overall, the rating scale function fit well. The reasons for the rating scale function fitting well are as follows. First, the counts used indicated regular distribution such as unimodal distribution. Second, each value of average measure grew when the category score increased. Third, the outfit mean square residuals of five categories ranged from .93 to 1.08.Last, the values of category thresholds were ordered from the lowest value to the highest.
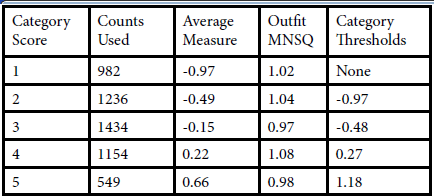
Table:1 Summary of Sources of Stress in Sport Inventory Rating Scale Function
Note. Average measure= a mean of logit measures for each category score; MNSQ = mean square residuals.
Figure 1 displays the category probabilities of the SSSI. The existing categorical combination was maintained, “12345”. The probabilistic curve is explained by using the corresponding rating scale category the curve represents (Figure 1). The logits measures are along the x-axis, and the y-axis and represent the probability of each response category across the scale. The figure demonstrates that the categories have clearly defined thresholds that are increasing.
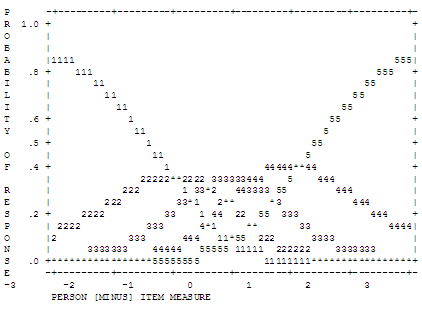
Figure:1 Category probabilities for Sources of Stress in Sport
Model Data Fit
The fit statistics were acceptable for all 16 items (M Infit MNSQ = 1.01 + 0.18; M Outfit MNSQ = 1.02 + 0.18 (Table 2). The Infit mean square scores ranged from 0.75- 1.38, and the Outfit mean square scores ranged from 0.77- 1.41. The results indicate a satisfactory model-data fit and a unidimensional structure for the SSSI scale.
Sources of Stress in Sport Inventory Item Difficulty
The sources of stress item difficulty, standard errors, and associated Infit and Outfit statistics are reported in Table 2. A higher logit score indicates a less stressful item. The sources of stress item difficulty estimates ranged from -0.54 to 0.81 logits. The least stressful item was question 5 (“argued with or booing from a spectator”) with a .81 logit (SE = 0.06). The most stressful item was question 9 (“made a physical or mental error”) with a -0.54 logit (SE =0.06). The item separation index was 5.48, which indicated that the SSSI was well spread out along the measurement scale. The separation reliability of0.97 indicated a high degree of confidence in replicating placement of the items within measurement error for another sample.
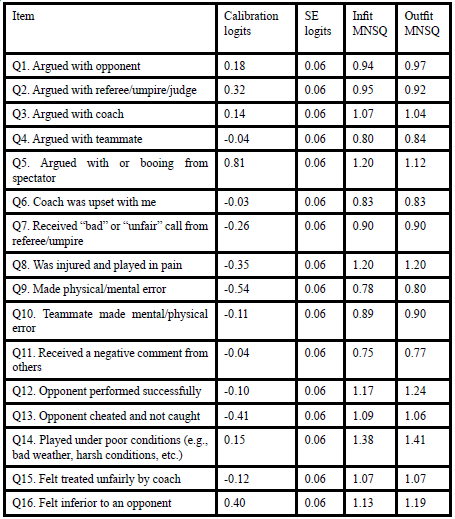
Table 2: Item summary of Rasch calibration of Sources of Stress in Sport Inventory Scale.
Individual level of Sources of Stress in Sport Inventory
Individual level of the perceived stress intensity was estimated by logits, where a higher logit indicated higher stress levels. The average of perceived stress intensity levels was -0.22 (SD = 0.74). The individual level of the perceived stress intensity estimates ranged from –2.05 to 2.33 logits. The person separation coefficient was 2.35 indicating that the persons’ ability varied moderately along the continuum. The person separation reliability coefficient was 0.85, which indicates a better than acceptable degree of confidence in replicating placement within measurement error.
Item-Person Map
Figure 2 summarizes the item-person map. The distribution displays the logit measures for item difficulty and for the person’s perceived stress intensity level for a specified source of stress. The logit score for the sources of stress items are shown on the right side of the map indicated by question number. The logit scale on the left of the map, indicated by “#” signs, displays persons’ perceived stress intensity level. The map indicates that, although persons’ perceived stress intensity level had moderate distribution, the item difficulty levels of SSSI showed slight bias toward moderate to high levels and did not provide coverage for lower levels of stress. The lower levels of stress in item difficulty were measured with lower accuracy (logits< 0.6). If more items measuring low stress levels would have been included in the SSSI, the results would have likely shown a better separation. Specifically, the item-person map indicated the presence of gaps on the lower end of the continuum, below the -0.5 logits (Figure 2). Lack of coverage of items indicate a need for more top stressful items perceived by players. In addition, the map shows that items 11, 4, and 6 and items 10, 12, and 15 were located similarly on the logits scale, respectively.
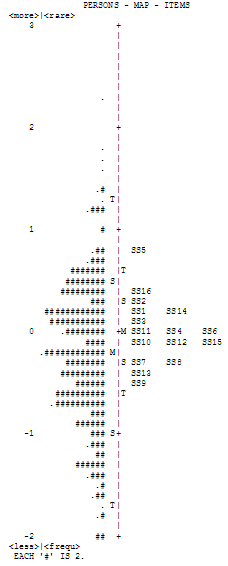
Figure 2: Item-person map of for Sources of Stress in Sport.
Discussion
The purpose of the study was to calibrate the sources of stress items associated with individual and team sport athletes using Rasch modeling. Ability parameters and item parameters were well distributed along the measurement scale. Although item parameters were slightly inappropriate in coverage, the ability parameters were acceptable. The results of the Rasch suggest that the SSSI is an effective scale to assess acute sources of stress in sport among college students. Specifically, the results indicate that the top four most intense stressors for athletes were “making a physical or mental error,” “opponent cheated and not caught,” “being injured and playing in pain,” and “received ‘bad’ or ‘unfair’ call from referee/umpire.” Stressors regarding playing in pain and making an error indicate variables with internal control such as the pressure placed upon oneself to play while in pain or to become frustrated with oneself if a mistake was made. Athletes must learn coping strategies that allow them to react and respond to these stressors effectively. Stressors outside of an athlete’s control include “unfair calls” and opposing players cheating and athletes must develop effective stress management tools. Although a top stressor for officials is when they make an incorrect call, these inaccurate or poor quality calls may always exist and players must create adaptation skills. The ability to play in a fair environment is important to athletes. Coping skills related to overcoming unfair game outcomes is important for coaches to teach their athletes. “Cheating” and “bad calls” may be an inevitable component to athletics. Skills developed to cope with unfair outcomes in sport are advantageous and necessary for all aspects of personal and professional life.
The results of previous research indicate that a top stressor is performance errors. Anshel and Wells found similar results for top stressors among basketball players (1999). A top stressor for competitive basketball players was making unforced errors, such as missing a basket or making the “wrong play.” Players place a great emphasis on perfect performance. Research from Nicholls, Jones, Ploman and Borkholes also indicate players feel great stress due to “cheating opponents” and “bad calls” from officials (2009). The current study and past research concur athletes must learn effective stress management strategies when performance error occurs.
Acute stressors that were ranked lowest in the current study included negative spectator comments, feeling inferior to an “opponent and arguing”. The least amount of acute stress pertains to communicative conflict and lack of confidence. Research findings in this study indicate that athletes are not as concerned with what other people think about them but what the athletes think about themselves. They are confident in their ability to perform but become stressed when they perform an error. The confidence that athletes reflect is a healthy attribute because they believe in themselves but the desire for perfectionism may cause negative health behaviors. However, other researchers examining professional rugby players and stress indicated athletes perceived high stress from being distracted by the crowd [30]. More research is needed to determine why rugby players have higher stress levels related to their surroundings. It is possible that arguing and booing from spectators may differ based on the type of sport as well as by the athletes participating in the sport.
The Rasch analysis warrants further consideration. The itemperson map indicated the presence of gaps on the lower end of the continuum, below -0.5 logits. Lack of coverage of items indicate a need for more top stressful items perceived by players. Close locations on the logits scale indicate that several items have the same difficulty level and thus, they might be candidates for exclusion should a shorter version of the inventory be necessary. Ability to reduce the number of items it’s a clear advantage of the Rasch model approach to item inventory validation. Therefore, future research is recommended to develop items to remove items with the same level of difficulty and add or fill in the gaps on the lower part of the continuum, such as for example with items on perfectionism and the ability to play in a fair environment.
The main limitation of this study include the lack of variety of individual and team sports. Specific sports may have significant differences in source of stress, and further research is needed. In addition, this study was limited to mainly two races, Caucasians and African Americans, but examining racial differences in sources of acute stress in sport (e.g., Latino, Asians) is needed.
Conclusion
Stress is widely known to have negative health outcomes. Because athletes experience various sources of stress, it is important to understand what stressors cause greater intensity. This study adds to the body of literature on athletes and stress by analyzing the sources of stress in sport and offering more information about perceived stress intensity levels among athletes.The current research study indicates that the highest intensity acute stressors involve pressure placed upon oneself and an unfair playing environment. Further research is needed to determine if acute sources of stress vary for specific individual and team sports and if acute stressors vary by ethnicity.
Understanding the sources of stress in athletes can help coaches better prepare athletes for competition and help athletes develop life skills to manage overall stressors. More research is needed to develop coping mechanisms for the pressure athletes’ place upon themselves. With advanced tools in managing stressors, athletes can better adapt to playing a competitive game and have more positive emotions leading to better health and higher quality of life.
Conflict of Interest
The Authors Declare no Conlflict of Interest
References
Lazarus R, Folkman S (1984) Stress, appraisal and coping. New York: Springer.View
Baum A (1990) Stress, intrusive imagery, and chronic distress. Health psychol 9: 653.View
Green RG (1985) Stress and accidents. Aviation Space Environment Med 56: 638- 641.View
Hockey GRJ (1997) Compensatory control in the regulation of human performance under stress and high workload: A cognitive-energetical framework. Biological psychol 45: 73-93.View
Taylor S (2003) Health Psychology. New York, NY: McGraw Hill.View
Anshel MH, Kaissidis AN (1997) Coping style and situational appraisals as predictors of coping strategies following stressful events in sport as a function of gender and skill level. British J Psychol 88: 263-276.View
Anshel MH, Kang M, Jubenville C (2013) Sources of acute sport stress scale for sports officials: Rasch calibration. Psychol Sport Exercise 14: 362-370.View
Nicholls AR, Holt NL, Polman RCJ, James DWG (2005) Stress, coping, and coping effectiveness among international adolescent golfers. J App Sport Psychol 17: 333-340.
Nicholls AR, Polman RCJ, Levy A, Taylor J, Cobley S (2007) Stressors, coping, and coping effectiveness: Gender, type of sport, and skill differences. J Sports Sci 25: 1521- 1530.View
Nicholls AR, Jones CR, Polman RCJ, Borkholes E (2009) Acute sport-related stressors, coping, and emotion among professional rugby union players during training and matches. Scandinavian J Med Sci Sports 19: 113- 120.View
Dunn JG, Nielsen AB (1996) A classificatory system of anxietyinduced situations in four team sports. J Sport Behav 19: 111- 131.
Anshel MH, Jamieson J, Raviv S (2001) Cognitive appraisals and coping strategies following acute stress among skilled competitive male and female athletes. J Sport Behavior 24: 128-143.View
Nicholls AR, Polman RC (2007) Stressors, coping, and coping effectiveness among players from the England under-18 rugby union team. J Sport Behav 30: 199-218.
Anshel MH, Delany J (2001) Acute Stress, Cognitive Appraisals and Coping Strategies of Male and Female Child Athletes. J Sport Behav 24: 329-353.
Gilbert JN, Gilbert W, Morawski C (2007) Coaching strategies for helping adolescent athletes cope with stress. J Phys Edu Recreat Dance 78: 13-24.
Anshel MH, Sutarso T (2007) Relationships between sources of acute stress and athletes’ coping style in competitive sport as a function of gender. Psychol Sport Exercise 8: 1-24.View
Nicholls AR, Levy AR, Grice A, Polman RC (2009) Stress appraisals, coping, and coping effectiveness among international cross-country runners during training and competition. Euro J Sport Sci 9: 285-293.View
Rasch G (1960) Probabilistic models for some intelligence and achievement tests. Copenhagen: Danish Institute for Educational Research.
Rasch G (1980) Probabilistic models for some intelligence and achievement tests. Chicago, IL: University of Chicago Press.
Anshel MH, Weatherby NL, Kang M, Watson T (2009) Rasch calibration of a unidimensional perfectionism inventory for sport. Psychol Sport Exercise 10: 210-216.View
Bond TG, Fox CM (2007) Applying the Rasch Model: Fundamental Measurement in the Human Sciences. Lawrence Erlbaum: Mahwah, New Jersey.View
Hambleton RK, Swaminathan H, Rogers HJ (1991) Fundamentals of item response theory. Newbury Park, CA: Sage Publications.View
Kang M, Zhu W, Ragan BG, Frogley M (2007) Exercise barrier severity and perseverance of active youth with physical disabilities. Rehab Psychol 52: 170-176.View
Zhu W, Updyke WF, Lewandowski C (1997) Post-hoc Rasch analysis of optimal categorization of an ordered-response scale. J Outcome Measurement 1: 286-304.View
Anshel MH, Wells B (2000) Sources of acute stress and coping styles in competitive sport. Anxiety Stress Coping 13: 1-26.View
Puente-Diaz R, Anshel MA (2005) Sources of acute stress, cognitive appraisal, and coping strategies among highly skilled Mexican and US competitive tennis players. J Social Psychol 145: 429- 446.View
Linacre J (2002) Optimizing rating scale category effectiveness. J App Measurement 3: 85-106.View
Fisher WP (1992) Reliability statistics. Rasch Measurement Transact 6: 238.
Anshel MH (1990) Toward validation of a model for coping with acute stress in sport. Int J Sport Psychol 21: 58-83.View
Nicholls AR, Holt NL, Polman RCJ, James DWG (2005) Stress, coping, and coping effectiveness among international adolescent golfers. J Appl Sport Psychol 17: 333-340.View