
- About the Journal
- Editorial Board
- Review Process
- Author Guidelines
- Article Processing Charges
- Special Issues
- Indexing
- Current Issue
- Past Issue
 Journal of Public Health Issues and Practices
Journal of Public Health Issues and Practices Volume 2 (2018), Article ID: JPHIP-126
https://doi.org/10.33790/jphip1100126Research Article
Trends in State and Federal OSH Enforcement
James P. Klyza*, Clint Pinion, D Gary Brown
Department of Environmental Health Science, Eastern Kentucky University, 521 Lancaster Avenue, Dizney 220, Richmond, KY 40475, USA.
Corresponding Author Details: James P. Klyza, Department of Environmental Health Sciences, Eastern Kentucky University, 521 Lancaster Avenue, Dizney 220, Richmond, KY 40475, USA. E-mail: James.klyza@eku.edu
Received date: 11th July, 2018
Accepted date: 03rd November, 2018
Published date: 23rd November, 2018
Citation: Klyza PJ, Pinion C, Brown DG (2018) Trends in State and Federal OSH Enforcement. J Pub Health Issue Pract 2: 126.
Copyright: ©2018, This is an open-access article distributed under the terms of the Creative Commons Attribution License, which permits unrestricted use, distribution, and reproduction in any medium, provided the original author and source are credited
Abstract
Background: OSHA evaluates State Occupational Safety & Health (OSH) enforcement annually through the Federal Annual Monitoring Evaluation (FAME) process. This process is used to determine whether Kentucky OSH (KY OSH) is meeting or exceeding OSHA performance. The FAME report for KY OSH based its evaluations on only 14.5% of the total number of cases in 2015 and did not test for statistical significance.
Objective: Determine the statistical significance of the 2015 FAME report deficiencies in the KY OSH program.
Method: The OSHA dataset consists of case detail for all inspections conducted from 1970 to present (updated daily). ANOVA (analysis of variance) regressions were performed to test the FAME trends for significance. The SAS 9.4 computer program was used for all statistical analysis.
Results: The models are either quadratic or linear regression trends from 1970 to 2016. Total, health, and safety inspections decreased in federal OSHA and KY OSH. Federal and KY number of violations for all safety or construction inspections decreased. Federal and KY number of violations per health inspection decreased. Federal and KY lapse time for all health inspections decreased per year. There was a decrease in willful violations cited by KY, not federal. The adjusted R-squared values explained from 0.3% to 59% of the variance, model power estimates varied from 50% to >99.9%, and the p-values ranged from <0.014 to <0.0001.
Conclusion: Overall, this study did not concur with the FAME Report. Since the OSH Act, effective enforcement may have led to decreased un-programmed activity through increased compliance.
Keywords: OSHA, State OSH Plans, FAME Report, industrial hygiene, safety, and occupational health
Introduction and Background
The Occupational Safety and Health Act of 1970 is best summarized by these excerpts: “To assure safe and healthful working conditions for working men and women; by authorizing enforcement of the standards developed under the Act; by assisting and encouraging the States in their efforts to assure safe and healthful working conditions; by providing for research, information, education, and training in the field of occupational safety and health; and for other purposes. Each employer shall furnish to each of his employees employment and a place of employment which are free from recognized hazards that are causing or are likely to cause death or serious physical harm to his employees. Each employer shall comply with occupational safety and health standards promulgated under this Act…” [1].
OSHA covers most private sector employers and workers in all 50 states, the District of Columbia, and the other United States (U.S.) jurisdictions either directly by federal OSHA or through an OSHAapproved State Plan. State Plans are OSHA-approved occupational safety and health programs operated by individual states instead of federal OSHA. Section 18 of the OSH Act encourages states to develop and operate their own occupational safety and health programs; states would then enforce OSHA standards once OSHA approved their State Plan. Federal OSHA approves and monitors all State Plans and provides as much as 50% of the funding for each program. State-run safety and health programs must meet or exceed the federal OSHA program. Twenty-two states or territories have OSHA-approved State Plans that cover both private and publicsector workers including Kentucky [2].
OSHA monitors and evaluates State Plans (including Kentucky) annually through the Federal Annual Monitoring Evaluation (FAME) process. This process is used to: determine whether the State Plan is continuing to operate at least as effectively as OSHA; track a State Plan's progress in achieving its strategic and annual performance goals; and ensure that the State Plan is meeting its mandated responsibilities under the OSH Act and other relevant regulations. If a state does not maintain adequate performance under the FAME process, it is possible for the Secretary of the Department of Labor to withdraw a state OSH program and replace it with the Federal program instead [1, 3, 4].
The example FY2015 FAME report on the Kentucky State Plan was prepared by Federal OSHA, Region IV, Atlanta, Georgia, and covers the period from October 1, 2014 through September 30, 2015. It is the Federal report on the operation and performance of the Commonwealth of Kentucky Occupational Safety and Health Program (KY OSH). It was compiled using information gained from KYOSH’s State Office Annual Report (SOAR) for FY2015, OSHA Information System (OIS) reports, OSHA Express reports, as well as the State Activity Mandated Measures (SAMM) Report for FY 2015. From the total of 885 inspections that year in Kentucky, 124 inspection case files were selected randomly for the FAME report. The 124 cases comprised of both safety and health inspections conducted in FY 2015, coupled with interviews, a review of procedures, and the available data [3].
The primary concerns after a review of the FAME report for Kentucky FY2015 is that approximately only 14.5% of the FY2015 inspections were included, and the statistics used were exclusively descriptive statistics (no hypothesis-testing). By limiting the sample of inspections to 14.5% of the total, the FAME report may have an unintentionally distorted distribution of the data in comparison with a sample of all 855 inspections. A descriptive statistic, whether a means, frequency, etc., may be utilized to find viable hypotheses to later test for statistical significance. However, descriptive statistics themselves are widely not considered valid to use for drawing conclusions regarding a hypothesis. For this reason, hypothesis test methods are necessary if the investigator wishes to find whether the hypothesis of interest is actually considered statistically significant (alternate hypothesis) or not (null hypothesis). In the case of the FY2015 FAME report for Kentucky, there is no mention of any hypothesis testing for statistical significance [3].
The following excerpts are sample statements from the KY OSH FY2015 FAME report then followed by the Commonwealth of Kentucky’s response to the report findings. “Data indicated that there has been a significant decline in the number of inspections conducted by KY OSH, a difference of 349 from FY 2009 to FY 2015, accounting for an overall reduction of 28.2%.”3“OSHA’s table on page eight (8) of the FAME regarding the decreasing number of inspections is incomplete and misleading. The table above does not present all pertinent information.... In some years, the projected number of inspections for the state was less than the previous year; in some years the projection was more than the previous year. Nonetheless, each year OSHA approved the number of projected inspections, regardless if it was a lesser number or a greater number than the previous year.” [4].
The FAME report based its performance evaluations on conclusions not tested for statistical significance. In addition, the FAME report only used a small sample of the readily available data which could lead to a biased result. For these reasons, the FAME report may have led to conclusions that differ greatly from those made with hypothesis tests of the same KY OSH performance-based metrics. The aim of this paper was to determine the statistical significance of seven of the 2015 FAME report deficiencies in the KY OSH program.
Specific Aims:
Evaluate the performance of the Commonwealth of Kentucky to meet or exceed Federal performance based on seven enforcement metric deficiencies from the Region IV FY2015 FAME Report.
- FAME Finding: Decreasing trend in total number of total KY OSH inspections in comparison with Federal OSHA trend.
- FAME Finding: Decreasing trend in number of KY OSH health inspections in comparison with Federal OSHA trend.
- FAME Finding: Decreasing trend in number of violations per inspection in KY OSH safety inspections in comparison with Federal OSHA trend.
- FAME Finding: Decreasing trend in number of violations per inspection in KY OSH safety construction inspections in comparison with Federal OSHA trend.
- FAME Finding: Decreasing trend in number of violations per inspection in KY OSH health inspections in comparison with Federal OSHA trend.
- FAME Finding: Increasing trend in lapse time in KY OSH health inspections in comparison with Federal OSHA trend.
- FAME Finding: Decreasing trend in number of willful citations in all KY OSH inspections in comparison with Federal OSHA trend.
Aims
Perform regression models from 1970 to 2016 KY OSH data in comparison with Federal OSHA data to test the previously listed trends for statistical significance.
Methods
The OSHA dataset consists of inspection case detail for approximately 100,000 OSHA inspections conducted annually. The dataset includes information regarding the reason for opening the inspection, and details on citations and penalty assessments resulting from violations of OSHA standards. Additionally, accident investigation information is provided, including textual descriptions of the accident, and details regarding the injuries and fatalities which occurred [2].
The SAS 9.4 statistical analysis computer program (SAS Institute, Cary, North Carolina) was used for all analysis, given that there were approximately 4,514,427 OSHA inspections from 1970 to 2016.5 In addition, when the violation sets are included, the sample size increases to 7,975,935 observations. Only inspections with violations that led to fines were included. In compliance inspections were not included in this analysis.
ANOVA (analysis of variance) regression models were performed on saturated models. The backwards elimination method was then used to reach to the most parsimonious model with an a priori alpha of p <0.05. In this process, the covariate with the highest p-value was removed from the model. This modified model was then rerun for significance of the covariates. The same elimination method was repeated until all remaining covariates were statistically significant. In addition, tests for normality of the ANOVA residuals, and outliers were performed for the models analyzed [6- [10]. The linear final ANOVA models were in the following univariate model format: Y = βo + β1(Calendar Year)+ E
The quadratic final ANOVA models were in the following bivariate model format: Y = βo + β1(Calendar Year)+ β2(Calendar Year)2+ E Where: Y = the dependent variable including: (total number of inspections, total number of health inspections, number of health violations per inspection, number of safety violations per inspection, health lapse time in days, and total number of willful violations).
Results
The results of the final models using analysis of variance (ANOVA) are on Figures 1 to 15 and Tables 1 to 16. Over approximately 45 years, there was a significant decrease in the total number of inspections done by KY OSH [F (2, 44) = 17.10, p <0.0001]. The adjusted R-square indicated that this model explained 42% of the variance (see Table 1). The model was quadratic with an initial positive slope from 1970 to 1994. Subsequently, from 1995 forward, the regression model for number of inspections per year had a negative slope (see Figure 1).
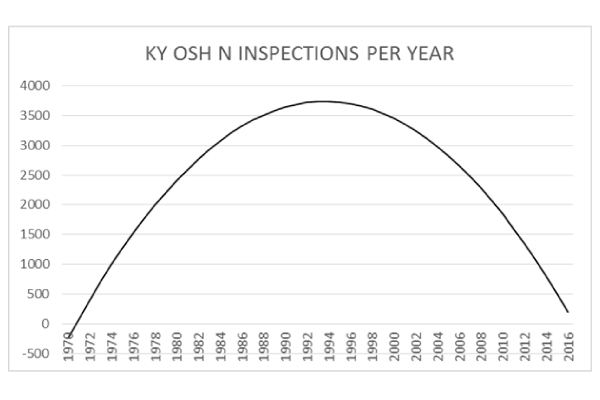
Figure:1

Table:1 ANOVA Number of Inspections per Year KY OSH State Plan
In a similar regression model, there was a significant decrease in the total number of inspections by Federal OSHA [F (2, 46) = 20.54, p <0.0001]. The adjusted R-square indicated that this model explained 46% of the variance (see Table 2). The model was quadratic with an initial positive slope from 1970 to 1988. Subsequently, from 1989 forward, the regression model for number of inspections per year had a negative slope (see Figure 2).
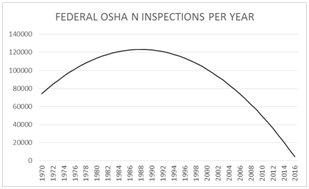
Figure:2

Table:2 ANOVA Number of Inspections per Year Federal OSHA Plan
There was a significant decrease in the number of health inspections done by KY OSH [F (2, 44) = 32.29, p <0.0001]. The adjusted R-square indicated that this model explained 59% of the variance (see Table 3). The model was quadratic with an initial positive slope from 1970 to 1995. Subsequently, from 1996 forward, the regression model for number of inspections per year had a negative slope (see Figure 3).
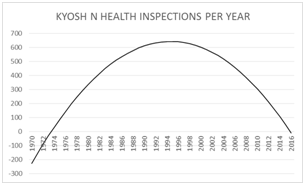
Figure:3

Table:3 ANOVA Number of Health Inspections per Year KY OSH State Plan
In an analogous model, there was a significant decrease in the number of health inspections done by Federal OSHA [F (2, 44) = 31.52, p <0.0001]. The adjusted R-square indicated that this model The model was quadratic with an initial positive slope from 1970 to 1994. Subsequently, from 1995 forward, the regression model for number of inspections per year had a negative slope (see Figure 4).
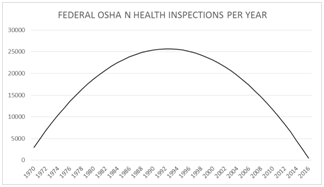
Figure:4

Table:4 ANOVA Number of Health Inspections per Year Federal OSHA Plan
There was a significant decrease in the number of safety inspections done by KY OSH [F (2, 44) = 13.78, p <0.0001]. The adjusted R-square indicated that this model explained 37% of the variance (see Table 5). The model was quadratic with an initial positive slope from 1970 to 1994. Subsequently, from 1995 forward, the regression model for number of inspections per year had a negative slope (see Figure 5).
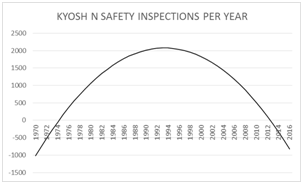
Figure:5
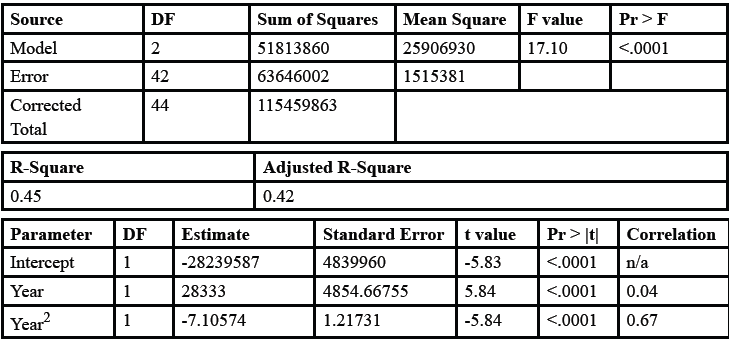
Table:5 ANOVA Number of Safety Inspections per Year KY OSH State Plan
There was also a significant decrease in the number of safety inspections by Federal OSHA [F (2, 46) = 16.58, p <0.0001]. The adjusted R-square indicated that this model explained 40% of the variance (see Table 6). The model was quadratic with an initial positive slope from 1970 to 1988. Subsequently, from 1989 forward, the regression model for number of inspections per year had a negative slope (see Figure 6).
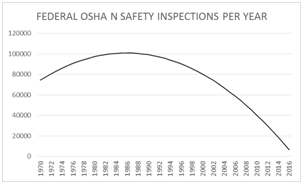
Figure:6

Table:6 ANOVA Number of Safety Inspections per Year Federal OSHA Plan
There was a significant decrease in the number of violations per safety inspection by KYOSH [F (1, 21889) = 1243.33, p <0.0001]. The adjusted R-square indicated that this model explained 5% of the variance (see Table 7). The model was linear with a slope of approximately -0.04 violations for each safety inspection per calendar year (see Figure 7).
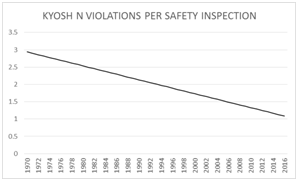
Figure:7

Table:7 ANOVA Number of Safety Violations per Inspection KY OSH State Plan
Similarly, there was a significant decrease in the number of violations per safety inspection by Federal OSHA [F (1, 1007514) = 40420.9, p <0.0001]. The adjusted R-square indicated that this model explained 4% of the variance (see Table 8). The model was linear with a slope of approximately -0.04 violations for each safety inspection per calendar year (see Figure 8).
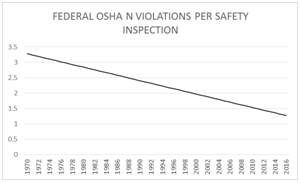
Figure:8

Table:8 ANOVA Number of Safety Violations per Inspection Federal OSHA Plan
There was a significant decrease in the number of safety violations in construction inspections by KYOSH [F (1, 9558) = 500.69, p <0.0001]. The adjusted R-square indicated that this model explained 5% of the variance (see Table 9). The model was linear with a slope of approximately -0.03 violations for each construction safety inspection per calendar year (see Figure 9).
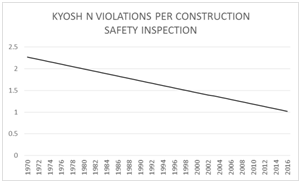
Figure:9

Table:9 ANOVA Number of Safety Violations per Construction Inspection KY OSH State Plan.
There was also a significant decrease in the number of safety violations in construction inspections by Federal OSHA [F (1, 399580) = 1139.68, p <0.0001]. The adjusted R-square indicated that this model explained 0.3% of the variance (see Table 10). The model was linear with a slope of approximately -0.01 violations for each construction safety inspection per calendar year (see Figure 10).
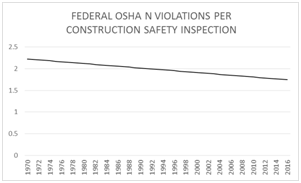
Figure:10

Table:10 ANOVA Number of Safety Violations per Construction Inspection Federal OSHA Plan.
There was a significant decrease in the number of violations per health inspection by KYOSH [F (1, 4607) = 25.03, p <0.0001]. The adjusted R-square indicated that this model explained 0.5% of the variance (see Table 11). The model was linear with a slope of approximately -0.02 violations for each health inspection per calendar year (see Figure 11).
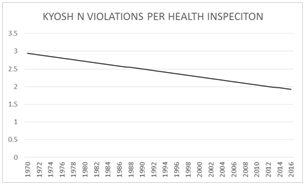
Figure:11

Table:11 ANOVA Number of Health Violations per Inspection KY OSH State Plan
There was also a significant decrease in the number of violations per health inspection by Federal OSHA [F (1, 215114) = 5027.99, p <0.0001]. The adjusted R-square indicated that this model explained 4% of the variance (see Table 12). The model was quadratic with an initial positive slope from 1970 to 1993. Subsequently, from 1994 forward, the regression model for number of inspections per year had a negative slope (see Figure 12).
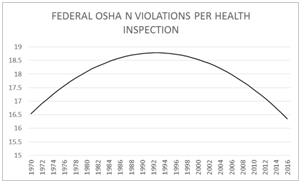
Figure:12

Table:12 ANOVA Number of Safety Violations per Inspection Federal OSHA Plan
There was a significant decrease in the lapse time per health inspection by KYOSH [F (1, 10961) = 3607.42, p <0.0001]. The adjusted R-square indicated that this model explained 25% of the variance (see Table 13). The model was linear with a slope of approximately -215.2 days from the sum of lapse time for all health inspections done per calendar year (see Figure 13).
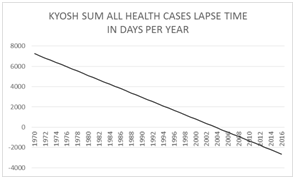
Figure:13

Table:13
Similarly, there was a significant decrease in the lapse time per health inspection by Federal OSHA [F (1, 525430) = 95991.8, p <0.0001]. The adjusted R-square indicated that this model explained 15% of the variance (see Table 14). The model was linear with a slope of approximately -149.9 days from the sum of lapse time for all health inspections done per calendar year (see Figure 14).
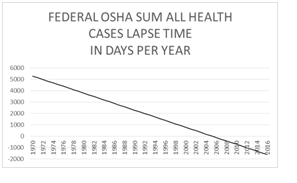
Figure:14

Table:14 ANOVA Number of Health Lapse Time (in Days) per Inspection Federal OSHA Plan
There was a significant decrease in the total number of willful violations cited by KYOSH [F (1, 201) = 6.10, p <0.014]. The adjusted R-square indicated that this model explained 2% of the variance (see Table 15). The model was linear with a slope of approximately -0.03 willful violations for each calendar year (see Figure 15). In contrast, there was no significant decrease or increase in the total number of willful violations cited by federal OSHA [F (1, 15989) = 3.77, p <0.052] (see Table 16).
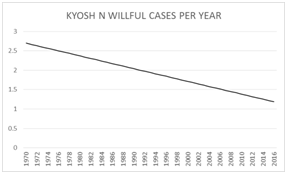
Figure:15

Table:15 ANOVA Number of Willful Violations per Year KY OSH State Plan

Table:16 ANOVA Number of Willful Violations per Year Federal OSHA Plan
Discussion
The aim of this paper was to evaluate the performance of the Commonwealth of Kentucky to meet or exceed federal performance based on seven enforcement metric deficiencies from the Region IV FY2015 FAME Report. The statistical significance and conclusions for these deficiencies differed from the FAME Report.
FAME indicated a decreasing trend in number of KY OSH total/ health/safety inspections in comparison with federal OSHA trend. Our statistical analysis indicated that total federal and Kentucky total/ health/safety inspections all decreased significantly. All three of our comparisons of KY OSH with OSHA differ from the FAME report.
FAME indicated a decreasing trend in number of violations per inspection in KY OSH safety inspections in comparison with the federal OSHA trend. Our analysis indicated that, in both federal and Kentucky inspections, violations per inspection for all safety and construction inspections decreased. Both comparisons differ from the FAME report.
FAME indicated a decreasing trend in number of violations per inspection in KY OSH health inspections in comparison with the federal OSHA trend. Our analysis indicated that, in both federal and Kentucky inspections, violations per inspection for all health inspections decreased. This comparison also does not concur with the FAME report.
FAME indicated an increasing trend in the lapse time for KY OSH health inspections in comparison with the federal OSHA trend. Our analysis indicated that, in both federal and Kentucky inspections, lapse time per health inspection decreased. The comparison also did not concur with the FAME report.
Finally, FAME indicated a decreasing trend in the number of willful citations in all KY OSH inspections in comparison with the federal OSHA trend. This result did concur with our study, there was a significant decrease in willful violations cited by Kentucky unlike the federal model with no change. In contrast with the other FAME deficiencies evaluated, this last comparison did agree with a conclusion of the FAME report.
Limitations
The models were all univariate or quadratic, using only year as the independent variable. There were no adjustments for legislative changes over time, the economy or the budget. However, these adjustments would likely be correlated with the time variable itself (year). In our opinion, collinearity could have been an issue if such covariates were included.10Underreporting of complaints by employees due to threats or monetary rewards may also be an issue.
Strengths
Overall, the large sample size provided by using the US DOL OSHA datasets gave statistical power to detect the hypothesized effect, all OSHA cases with violations were included (reduced selection bias), and the data came directly from the source, making it more valid.
Conclusion
Overall, this study did not concur with the FAME Report, with the exception of the decrease in willful citations over time by KY OSH. Un-programmed inspections are complaint-based and are influenced greatly by the workplace safety perception of the complainant (employee or significant other). Programmed inspections are policy based and are more influenced by the national office or governmentemployed data analysts. Over the time since the OSH Act, effective enforcement may have led to decreased un-programmed activity through increased compliance. In the future, other Department of Labor enforcement data such as from Wage and Hour or Whistleblower could be used as an adjustment for underreporting of complaints.
References
Public Law 91-596, 84 STAT.1590, 91st Congress, S.2193, December 29, 1970 as amended through January 1, 2004.View
United States Department of Labor (2018) Occupational Safety and Health Administration, State Program.View
FY 2015 Comprehensive Federal Annual Monitoring and Evaluation (FAME) Report: On the Kentucky Labor Cabinet Department of Workplace Standards Occupational Safety and Health Program from October 1, 2014 – September 30, 2015. Prepared by the U.S. Department of Labor, Region IV, Atlanta, GA.
Kentucky Labor Cabinet Occupational Safety and Health Program Response to Federal Annual Monitoring Evaluation for Federal Fiscal Year 2015.
SAS version 9.4 Statistical Software (2018), SAS Institute, Cary, North Carolina.View
Applied Regression Analysis and Other Multivariable Methods. 3rd Edition. David G Klienbaum, Lawrence L Kupper, Keith E Muller. 1998.View
Shapiro SS, Wilk MB (1965) “An Analysis of Variance Test for Normality (Complete Samples),” Biometrika 52: 591–611.View
Royston JP (1992) “Approximating the Shapiro-Wilk’s W Test for Nonnormality,” Statistics and Computing 2: 126–119.
D’Agostino R, Stephens M (1986) Goodness-of-Fit Techniques, New York: Marcel Dekker.View
Belsley DA, Edwin K, Roy EW (1980). Regression Diagnostics: Identifying Influential Data and Sources of Collinearity. New York: John Wiley and Sons.View