
- About the Journal
- Editorial Board
- Review Process
- Author Guidelines
- Article Processing Charges
- Special Issues
- Indexing
- Current Issue
- Past Issue
 Journal of Public Health Issues and Practices
Journal of Public Health Issues and Practices Volume 3 (2019), Article ID: JPHIP-139
https://doi.org/10.33790/jphip1100139Research Article
Study for Development of Health Belief Scale Related to Lead Exposure
Tugba Gultekin1*, Yeter Kitis2
1First and Emergency Aid Program, Vocational School of Health Services, Dokuz Eylul University, Izmir, 35340, Turkey.
22Department of Public Health Nursing, Faculty of Health Sciences, Gazi University, Ankara, 06500, Turkey.
Corresponding Author Details: Tugba Gultekin, First and Emergency Aid Program, Vocational School of Health Services, Dokuz Eylul University, Izmir, 35340, Turkey. E-mail: tugba.gultekin@deu.edu.tr
Received date: 01st March, 2019
Accepted date: 02nd April, 2019
Published date: 05th April, 2019
Citation: Gultekin, T., & Kitis, Y. (2019). Study for Development of Health Belief Scale Related to Lead Exposure. J Pub Health Issue Pract 3: 139.
Copyright: ©2019, This is an open-access article distributed under the terms of the Creative Commons Attribution License, which permits unrestricted use, distribution, and reproduction in any medium, provided the original author and source are credited
Abstract
Background/Aim: This methodological study was conducted to develop a health belief scale for lead exposure, and to analyze the validity and reliability of the scale.
Materials and Methods: The study was carried out on 525 male workers applying to Ankara Occupational Diseases Hospital between February 1 and April 30, 2013. The Participant Information Form and the Health Belief Scale Related to Lead Exposure (HBSRLE) were used to collect data. Data content validity was analyzed with Law she technique by the experts of the subject, construct validity with factor analysis, and reliability with Cronbach's alpha coefficient and Spearman correlation analysis.
Results: Construct validity analysis revealed that the scale was composed of six factors with factor loads ranging from .615 to .832 (p<0.05). Reliability analysis revealed that HBSRLE's Cronbach's alpha reliability coefficient was .94 and sub-dimensions ranged from .81 to .94. Based on split-half reliability analysis, Spearman- Brown coefficient of the Scale was .740 and the Gutman Split- Half Coefficient was .739 (p<0.05). Spearman correlation analysis showed that item-total score correlations (Rho) ranged from .233 to .868 (p<0.001).
Discussionand Conclusions: As a result of validity and reliability analyses, it was found that HBSRLE, consisting of 33 items and six sub-dimensions, is a valid and reliable scale.
Key Words: Scale development, Validation, Reliability, Lead Exposure, Health Belief Model
Introduction
Lead is a heavy metal with no biochemical or physiological function in the organism, which is long known to repress cellular events and damage vital organs. People are exposed to lead environmentally or occupationally. In parallel to increased urbanization and industrialization in today’s industrializing societies, amount of lead, which is commonly found in nature, have significantly increased in human body. This problem has begun to pose a risk for public health as necessary measures are not taken simultaneously [1,2].
Among other heavy metals, lead is the most widely used one with identified toxicological effects. Lead is used in more than 150 business lines in industry due to its availability and practical use. Therefore, lead exposure occurs in a wide range of fields [3,4].
Lead exposure is quite common around the world, with decreasing cases in developed countries. Occupational exposure to lead occurs in extraction and processing of lead in mine quarries, preparation of lead alloys, production of lead containing batteries, paint, tires, glass, ceramics and lead compounds, firearms training, bullet production, ship making, demolition and welding, lead oil production, accumulator production and repair [5,6]. Lead powder and fume that is produced during these activities and that intensively spreads to the environment causes occupational exposure. Lead poisoning cases mostly occur in accumulator industry and small workplaces with poor ventilation [7,8].
Lead has been shown to have various health effects. After exposure, lead affects various systems and organs, particularly hematologic system, gastrointestinal system, central nervous system, cardiovascular system, kidneys and liver; and causes serious problems in terms of reproductive health. Blood lead causes hearing loss at a concentration of 20 μg/dl, and nephropathy and decreased nerve conduction at a concentration of 40μg/dl [9-11]. Lead encephalopathy can develop when blood lead level exceeds80–100 μg/dl in children and 100–120 μg/dl in adults. Lead encephalopathy can be acute or chronic. Acute lead encephalopathy can develop shortly after acute lead poisoning due to lead exposure [5].
Improvement of working conditions, work hygiene, safety warnings and measurement of inorganic lead and compounds at regular intervals and keeping them at the desired level within the workplace are of vital importance [12]. Presence of an adequate and effective ventilation system and the use of wet working system should be the first measures to be taken for protection from lead. Other necessary measures include separation of cafeterias from working areas, presence of toilets, shower and changing rooms and obeying daily working hours set out by law. On the other hand, preventive health behaviors of employees are also important to prevent intake of lead powder and fume in the air. These behaviors can include effective use of protective equipment such as work clothing, mask and gloves, avoiding smoking in the working area, avoiding eating or drinking, washing hands before meals and taking a shower after each shift [13].
Perceptions and attitudes of individuals about health are closely related with their health behaviors and are particularly important in terms of preventive health services. Health perceptions indicate to what extent an individual is psychologically open to performing preventive behaviors. An employee who understands the benefits of performing preventive health behaviors and who encounters minimum obstacles in displaying these behaviors is expected to have a higher ratio of exhibiting the expected preventive health behavior. It is also important to determine whether the employee intends to exhibit preventive health behaviors and the belief of the individual in successfully performing an action [14,15].
A high number of people work in metal sector, which is a dangerous and hazardous work group where lead is used. Negative effects of lead on health and workforce losses can be prevented by taking precautionary measures for this work group [16]. Within the framework of Health Belief Model, there is a need to develop a scale to determine the internal factors that affect employees to display or not to display preventive health behaviors. If the developed model is found to be valid and reliable, it can be used by occupational health professionals to explain preventive health behaviors in improving the health of employees.
The aim of this study is to develop a health belief scale for lead exposure, and to analyze the validity and reliability of the scale.
Materials and methods
In this methodological study,three steps were undertaken to develop a scale:
The creation of scale items and submission to experts for evaluation in terms of content validity.
Scale items were developed based on Health Belief Model (HBM). Literature on Fundamentals of Health Belief Model [31-34] and studies that used HBM [15,19-25] were used to create an item pool in line with the determined framework. The statements in the scale were tried to be structured in six sub-dimensions (perceived sensitivity, perceived seriousness, perceived usefulness, perceived obstacle, health motivation, and self-sufficiency) in accordance with Health Belief Model.
In order to meet the criteria prescribed in item writing, and to make statements clear and understandable, care was taken not to imply different meanings, and an item pool consisting of 107 items were created this way. This item pool was sent to six people who were specialized in the fields of public health, occupational health, and scale development. Lawshe technique was used to evaluate experts’ views. Content Validity Ratios (CVR) were calculated with the Lawshe technique according to experts’ views for each item as “appropriate or highly appropriate” using the following formula [17]: CVRi = ne – N/2÷N/2
CVRi: Content Validity of item iof the scale.
ne: Number of referees who stated that the statement is “appropriate or highly appropriate”.
N: Total number of referees.
The CVR values calculated by the applied formula varied between -1 and +1. Items with negative orzero values in the first stage were excluded from the scale. In order to decide on items with positive values, minimum content validity ratios were determined at Lawshe p=0.05 (one-way) confidence interval. 67 items with validity ratios below .99 according to number of experts were excluded from the scale [17,27]. 40 items with a CVR value of +1 remained in the scale. The remaining items were arranged according to expert views.
7 more items were excluded from the scale after validity and reliability analyses. Health Belief Scale Related to Lead Exposure containing 33 items on the specified behaviors of the workers was given its final form. The scale consisted of 3 statements for “Perceived Sensitivity” sub-dimension, 5 statements for “Perceived Seriousness” sub-dimension, 6 statements for “Perceived Benefit” sub-dimension, 8 statements for “Perceived Obstacles” sub-dimension, 6 statements for “Health Motivation”, and 5 statements of “Self-Sufficiency” subdimension.
Of the determined 33 statements, 25 are positive, while 8 are negative (items21-28). It is a five-pointLikert scale with scores ranging from 1 to 5 (1=strongly disagree, 5=strongly agree). Negative items are scored inversely. Minimum and maximum possible scores that can be obtained from the scale are 33 and 165, respectively. A preliminary application was performed on a group of 20 people to determine the comprehensibility and application time of the scale. The items that could not be comprehended were reorganized and application time was determined as 5-10 minutes.
Implementation of Draft Scale
At this stage of the study, we tried to reach 10 times the number of items while determining the sampling size. Drafted scale was applied to 525 workers who were employed in jobs related with lead or lead compounds who were admitted to Ankara Occupational Diseases Hospital occupational outpatient clinic between February 1 and April 30 2013 for periodical examination. In addition, some of the data was collected via Participant Information Form consisting of sociodemographic characteristics of the workers, working time, smoking status, and status of being affected by lead.
Data were collected as self-statement in a room reserved for this purpose in the outpatient clinic. The participants were informed about the research and their written consents were collected after the explanations.
Reliability and Validity Analysis of Draft Scale
SPSS 15.0 package software was used to evaluate the collected data. Kaiser Meyer Olkin (KMO) Coefficient and Bartlett’s Sphericity Test were used to analyze whether the data were appropriate for analysis [29].
Kaiser Meyer Olkin (KMO) value was found to be 0.90 (>0.60) as presented in Table 1. Bartlett Sphericity test result was found to be 19057.439 (p<0.05). The result of the Bartlett Sphericity test was 19057.439 (p<0.05).
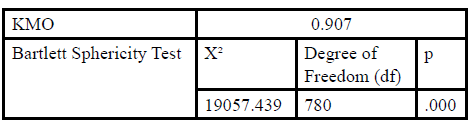
Table:1 KMO and Bartlett Sphericity Test Results of HBSRLE.
Factor analysis was used for construct validity. Principal Component Analysis was conducted to test construct validity and Varimax Rotation method was used to interpret the factors more conveniently [30].
Spearman’s correlation analyses (item-total score correlation, subdimension- total score correlations) were used to test the reliability of the scale. Guttman Split-Half method was used to test consistency between observers for split-half reliability and Spearman-Brown Reliability Coefficient was used to balance internal consistency.
Results
Descriptive Findings
The study group consisted of male workers. Mean age was 35.7 ± 7.9 years (lowest: 21, highest: 63), % 75.4 (n: 396) were married, while 24.6% (n:129) were single. Of the workers, 4% (n:2) were literate, 8.2% (n:43) were primary education graduates and 91.4% (n: 480) were high school or higher education graduates. 7.8% were working in lead bullet production, 19.4% were working in lead and lead compounds production, 18.7% were working in explosive capsule production, 10.3% were working accumulator production, 9.5% were working in paint production, 5.7% were working in welding, 4.8% were working in metal coating, and 3.8% were working in battery production. Average weekly working hours for the workers was 53.2 ± 11.4 hours (minimum: 40, maximum: 90).
Findings Regarding the Validity and Reliability of HBSRLE
Factor analysis, Principle Components Analysis and Varimax Rotation method were used in the study. Number of factors was not limited; the factors having an eigenvalue of 2 were included in the study. Initially, an eight factor structure was obtained from the principle components analysis. 34 items with similar factor loads in three different subdimensions (Table 2) and 8 factors with an eigenvalue of 1.96 (items 5, 7 and 15) were excluded from the scale. The analysis was reapplied and the scale was divided into seven factors. 18 items with similar item loads in three dimensions (Table 2) and 7 factors with an eigenvalue of 1.94 (items 13 and 20) were excluded from the scale. A total of seven items were removed from the scale. Factors analysis was conducted again and six factors with an eigenvalue of 2 were obtained. It was found that the scale had six sub-factors with factor loads varying between 0.613 and 0.885 (p<.05). Results of factor analysis are presented in Table 2. It was found that the first factor with an eigen value of 7.21 and an explained variance of 21.86% had the highest values, while the sixth factor with an eigenvalue of 2.58 and an explained variance of 7.84% had the lowest values. Total variance for which all factors were explained was 73.29%.
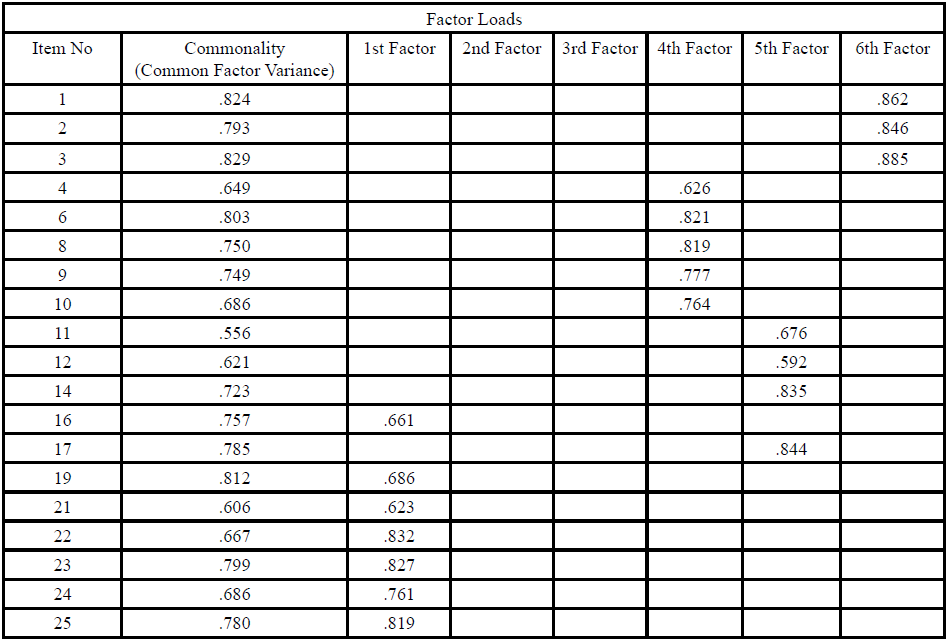
Table:2 Factor Analysis Results* of HBSRLE.
* Principal Component Analysis
Analysis of six-factor structure ofHBSRLE with factor analysis revealed that Factor 1 consisted of 10 items (items 21, 22, 23, 24, 25, 26, 27 28, 16 and 19) and constituted “Perceived Obstacle” sub-dimension. Factor 2 consisted of 5 items (items 36, 37, 38, 39 and 40) and constituted “Self-Sufficiency” sub-dimension. Factor 3 consisted of 6 items (items 29, 30, 31, 32, 33 and 35) and constituted “Health Motivation” sub-dimension. Factor 4 consisted of 5 items (items 4, 6, 8, 9 and 10) and constituted “Perceived Seriousness” sub-dimension. Factor 5 consisted of 4 items (items 11, 12, 14 and 17) and constituted “Perceived Benefit” sub-dimension. Factor 6 consisted of 3 items (items 1, 2 and 3) and constituted “Perceived Sensitivity” sub-dimension.
Reliability Findings of the Scale
Cronbach’s Alpha (Internal Consistency Analysis), Spearman- Brown and Guttman Split- Half Reliability Coefficient and Correlation Analysis (Item-Total Correlation, Sub-dimension-Total Score Correlation) were used to evaluate total internal reliability of the scale.
Prior to item analysis of HBSRLE, the scale was analyzed to verify whether it fit normal distribution. Non-parametric Kolmogorov- Smirnov Test was used to test whether the scores of the scale in general and sub-dimensions were normally distributed. Obtained data revealed that significance level was higher than .25. The scores of HBSRLE and its sub-dimensions were considered to show normal distribution.
Spearman correlation analysis results presented in Table 3 showed that total score correlations (Rho) varied between 0.252 and 0.788 (p<0.001). Arithmetic mean of the item scores of the scale varied between 3.82 ± 4.54, while standard deviation values varied between 0.55 ± 0.91.
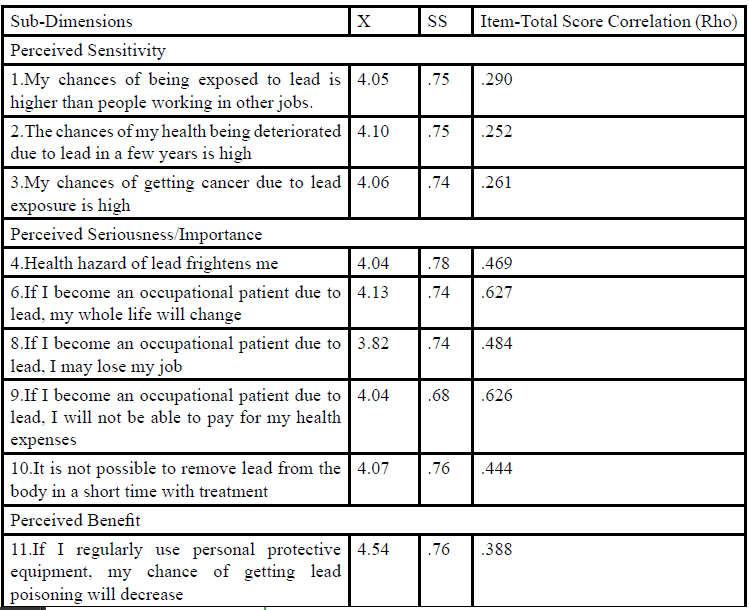
Table:3 Arithmetic Mean, Standard Deviation, and Item-Total Score Correlation Values* of All Items of HBSRLE (N = 525).
Reliability analysis showed that Cronbach’s Alpha of HBSRLE was 0.94 and its sub-dimensions varied between 0.81 and 0.94. Split-half test consistency showed that Spearman-Brown Coefficient of the scale was 0.740 and Guttman Split-Half Coefficient was 0.739 (p<0.05). Internal consistency coefficients for the general of HBSRLE are presented in Table 4.
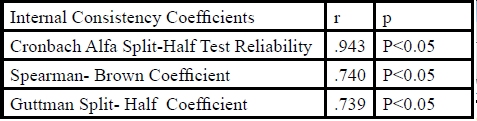
Table:4 Internal Consistency Coefficients of Entire HBSRLE.
Discussion
A KMO value of 0.60 and above is accepted as normal; while a KMO value between 0.80 and 0.90 is considered as very good (17, 26).In this study the KMO value was 0.90. Samplesize wasadequate to conduct factor analysis. Bartlett’s test value was 19057.439 (p< 0.05) (Table 1). It was concluded that the data was appropriate for factor analysis.
Analysis of the items in sub-dimensions according to the results of factor analysis showed that items 16 and 19 wereunder another subdimension (perceived obstacle) rather than their own sub-dimension (perceived benefit) (Table 2). As these items showed a similar correlation with the score of their own sub-dimension, they were added to the perceived benefit sub-dimension and kept in the scale.
Cronbach’s alpha coefficient forHBSRLE in its entiretyand for all sub-dimensions varied between 0.81 and 0.94. Since Cronbach’s alpha values of the entire scale and all its sub-dimensions were greater than 0.70, it can be stated that all items in the scale measure the same characteristic. According to this result, HBSRLE is a reliable measurement instrument [17].
Guttman and Spearman-Brown reliability coefficientswere used for analyses conducted for split-half test consistency within internal consistency analyses. In split-half method, the reliability coefficient should be minimum 0.70 [17,28].
It was found that Guttman Split-Half reliability coefficient calculated for the entire scale and sub-dimensions of HBSRLE varied between 0.739 and 0.951, while Spearman-Brown reliability coefficient varied between 0.740 and 0.953 (Table 4). The fact that reliability coefficient for the entirety and all sub-dimensions of the scale are higher than > 0.70 indicates that the scale and its subdimensions are reliable (p< 0.005).
Correlation analysis between the items is performed to show whether the relationships between the items are strong or weak and to determine consistency between the items. Correlation analysis between total score and item scores aim to determine the reliability of items. When calculating correlation between items, since total scores are considered as uniform data while item scores are considered as ranked data in item-total score correlation, Spearman’s rank correlation analysis was used. Items should have a high correlation with total score. Items with a total score-item correlation coefficient below 0.30 are excluded from the scale. If the item-total score correlation coefficient is below 0.20 in a sample with four hundred or more participants, it means that these items are problematic. Those items have to be removed from the scale [17].
In our study, analysis of the correlations between item-total scores of HBSRLE revealed that item-total score correlations for all questions (rho) varied between 0.252 and 0.788. As no items had a correlation value below 0.20, no item was removed from the scale (Table 3).
Analysis of sub-dimension-total score correlations of HBSRLE showed that “Perceived Obstacles” sub-dimensionhad the strongest correlation with a 0.790 sub-dimension-total score correlation. On the other hand, “Perceived Sensitivity” sub-dimension with sub-dimension-total score correlation of 0.283 had the weakest correlation. As for all sub-dimensions of the scale, it was observed that they were correlated with total scores and that all sub-dimensions excluding perceived sensitivity had a moderately strong positive correlation.
Conclusion
Validity and reliability analyses showed that HBSRLE consisting of 33 items and six sub-dimensions is a valid and reliable scale. The scale can be used in studies to determine health beliefs and protective heath behaviors of workers with lead exposure in the field of occupational health.
Conflict of Interest
The authors have no conflict of interest.
References
Timbrell JA (2002) Introduction to Toxicology. 3rd ed. Taylor & Francis, Philadelphia, USA.View
Needleman H (2004) Lead Poisoning. Annual Review of Medicine 55: 209-222.View
Todd AC, Chettle DR (2003) Calculating the uncertainty in lead concentration for in vivo bone lead x-ray fluorescence. Phys Med Biol 48: 2033-2039.View
Gidlow DA (2004). Lead Toxicity. Occup Med 54: 76–81.View
Goyer RA, Clarkson TW (2001) Toxic Effects of Metals In: Casarett and Doull’s Toxicology The Basic Science of Poisions, Klaassen CD (Eds.) 6th ed., The McGraw-Hill Companies, New York, USA.View
Gulson BL, Jameson CW, Mahaffey KR, Mizon KJ, Patison N et al. (1998) Relationships of Lead in Breast Milk to Lead in Blood, Urine and Diet of The İnfant and Mother. Environ Health Perspect 106: 667–74.View
Kuruvilla A, Pillay VV, Adhikari P, Venkatesh T, Chakrapani M et al. (2006) Clinical manifestations of lead workers of Mangalore, India. Toxicology and Industrial Health 22: 405– 413.View
Bakırcı N, GedikBakırcı L (2007) Assessment of Lead Exposure Among the Workers in a Storage Battery Factory. Marmara Med J 20: 66-74.View
Sanborn MD, Abelsohn A, Campbell M, Weir E (2002) Identifying and Managing Adverse Environmental Health Effects. CMAJ 166: 1287-1292.View
Ning T, Zi Q (2003) Adverse Reproductive Effects in Female Workers of Lead Battery Plants. Int J Occup Med. Envir Health 16: 356-361.View
Hoffman R, Nelson L, Howland M, Lewin N, Folemenbaum N et al. (2007) The Clinical Basis of Medical Toxicology, Goldfranks Manual of Toxicologic Emergencies. New York. Mc Graw Hill Company 2007; 722-732.
National Institute for Occupational Safety and Health (NIOSH): “Protecting Workers Exposed to Lead-based Paint Hazards. Report to Congress.” DHHS (NIOSH) Publication No. 98-112, January 1997.
Occupational Safety and Health Administration (OSHA) (2005) “Protecting Workers from Lead Hazards.” U.S. Department of Labor (800) 321-OSHA DSTM 9/2005.View
Steadman L, Quine L (2004) Encouraging young males to perform testicular self-examination: a simple, but effective, implementation intentions intervention. Brit J Health Psychol 9: 479-488.View
Champion VL (1999) Revised susuceptibility, benefits, and barriers scale for mammography screening. Res Nurs Health 22: 341-348.View
Dundar Y, Aslan R (2005) Effects of Lead as a Life Surrounding Heavy Metal. Medical J Kocatepe 6: 1-5.View
Sencan H (2005) Reliability and validity of the Social and Behavioral Measurement.
Buyukozturk S (2008) Data Analysis for the Social Sciences Handbook.
Cenesiz E (2008) Evaluation of the research in the Health Belief Model in Turkey. MSc, Ankara Universitesi, Ankara, Turkey.
Lee BK (2011) Occupational Health Management in the Lead Industry: The Korean Experience. Saf Health Work 2: 87-96.View
Unsal A, Tozun M (2007) Lead and Health Effects. Osmangazi Med J 29: 61-67.
Anagnostopoulos F, Dimitrakaki C, Niakas D, Tountas Y (2013) Validity and reliability assessment of health belief scales for mammography screening in Greek asymptomatic women. Psycho-Oncology 22: 1912–1917.View
Parsa P, Kandiah M, Mohd Nasir MT, Hejar AR, Nor Afiah MZ et al. (2008) Reliability and validity of Champion’s Health Belief Model Scale for breast cancer screening among Malaysian women. Singap Med J 49: 897-903.View
Gutierrez J, Long JA (2011) Reliability and validity of diabetes specific Health Beliefs Model scales in patients with diabetes and serious mental illness. Diabetes Res Clin Pract 92: 342-347.View
Gozum S, Aydın İ (2004) Validation Evidence for Turkish Adaptation of Champion's Health Belief Model Scales. Cancer Nursing: İnt Journal Cancer Care 27: 425-509.View
Tavsancıl ET (2006) Measurement of attitudes and Data Analysis with SPSS. 3th ed., Nobel Publications, Ankara, Turkey.
Hovardaoglu S (2007) Research Methods for the Behavioral Sciences, Hatiboglu Publisher, Ankara, Turkey.View
Tezbasaran A (1997) Likert Scale Development Guide. 2th ed. Publication of the Turkish Psychological Association, Ankara, Tukey.
Triggs T., Moss S (2002) Preparation Before Exploratory Factor Analysis.
Ender P (2008) Princes Components Analysis.
Janz NK, Becker MH (1984) The Health Belief Model: A Decade Later Health Education Querterly 11: 1-47.View
Taylor D, Bury M, Campling N, Carter S, Garfied S et al. (2007) Newbould N, Rennie T. A and National Institute for Health and Clinical Excellent. Review of the use of the Health Belief Model (HBM), the Theory of Reasoned Action (TRA), the Theory of Planned Behaviour (TPB) and the Trans-Theoretical Model (TTM) to study and predict health related behavior change.
Rosenstock IM, Strecher VJ, Becker MH (1988) Social Learning Theory and the Health Belief Model. Health Education Quarterly 15; 2: 175-183.View
Suttona S (2002) Health Behavior: Psychosocial Theories.View