
- About the Journal
- Editorial Board
- Review Process
- Author Guidelines
- Article Processing Charges
- Special Issues
- Indexing
- Current Issue
- Past Issue
 Journal of Public Health Issues and Practices
Journal of Public Health Issues and Practices Volume 3 (2019), Article ID: JPHIP-145
https://doi.org/10.33790/jphip1100145Research Article
Prevalence and Socioeconomic Disparities in Depression among US Adults: National Health and Nutrition Examination Survey, 2015-2016
Azad R. Bhuiyan*, Nusrat Kabir, Marinelle Payton, Amal K. Mitra
Department of Epidemiology and Biostatistics, School of Public Health, Jackson State University, Jackson, MS 39213, USA.
Corresponding Author Details: Azad R. Bhuiyan, Associate Professor, Department of Epidemiology and Biostatistics, School of Public Health, Jackson StateUniversity, Jackson, MS 39213, USA. E-mail: azad.r.bhuiyan@jsums.edu
Received date: 03rd July, 2019
Accepted date: 03rd September, 2019
Published date: 04th September, 2019
Citation: Bhuiyan, A.R., Kabir, N., Payton, M., Mitra, A.K. (2019). Prevalence and Socioeconomic Disparities in Depression among US Adults: National Health and Nutrition Examination Survey, 2015-2016. J Pub Health Issue Pract 3(2):145.
Copyright: ©2019, This is an open-access article distributed under the terms of the Creative Commons Attribution License, which permits unrestricted use, distribution, and reproduction in any medium, provided the original author and source are credited
Abstract
Introduction: Depression is a major public health concern as it relates to chronic diseases such as cardiovascular diseases, type 2 diabetes mellitus. Despite the association of depression with chronic diseases, a limited number of studies are available to examine the prevalence of depression and its association with socio-economic status (SES)in the US adult general population.
Aim: The purpose of this study was to 1) determine the prevalence of depression among US adult population using current data from National Health and Nutrition Examine Survey (NHANES), 2015- 2016; and 2) examine the magnitude of association of SES with depression among this general adult population.
Methods: We analyzed data from 5,164 participants of NHANES, 2015-2016, which is a multistage cluster sample design survey, representing the non-institutionalized US adult population. Depression was assessed using the Patient Health Questionnaire (PHQ-9). PHQ-9 ≥10 is considered having depression. SES was measured by education and family poverty income ratio (PIR). We categorized PIR into low, medium, and high. Education was categorized into four groups: up to 11th grade, high school completed or general education development (GED), some college or associate of arts, and college graduate or above. Proc survey procedure was applied in SAS 9.2.4 version, and the weighted percentage, and odds ratios (OR) with 95% confidence interval (CI) were reported.
Results: The prevalence of depression was 7.47% in the NHANES, 2015-2016, which represented 16.5 million people. The OR of depression among females was 1.73 times higher (95% CI: 1.30,2.31) compared to males. The OR of depression was 2.98 times higher with low PIR (95% CI: 1.58,5.60) in comparison to people with high PIR.
Conclusion: Given the high prevalence of depression, primary care practitioner, public health professionals, and health care policy makers should be aware of depression with special attention to the female gender and individuals with low PIR.
Keywords: Depression, Socioeconomic Status (SES), Education, family poverty to income ratio (PIR), Epidemiologic study, Crosssectional study
Introduction
Depression is a major public health threat as it relates to many chronic diseases including cardiovascular disease, type 2 diabetes, cancer, and chronic obstructive pulmonary disease [1-4]. At least one in five US adults’ experiences depression in their life time, and the prevalence of depression is approximately 8% [5]. The World Health Organization (WHO) identified depression as the fourth major cause of total disease load and the leading cause of disability worldwide [6]. According to WHO, depression is expected to be the second leading cause of disability by 2020 and the largest contributor to disease burden by 2030. Several studies have stated an increase in the prevalence of depression [7,8]. Depression is linked to increased morbidity as depression decreases psychosocial abilities and work performance and increases the risk of absenteeism in the workplace [9,10].
In December 2010, the Department of Health and Human Services launched Healthy People 2020, which highlighted the social determinants of health. The goal of Healthy People 2020 for mental health and mental disorders is to improve mental health through anticipation and by confirming access to suitable, quality mental health services [11]. Many studies focus on SES and its association with depression [12-14]. According to Lorant and colleagues, low SES-individuals are more prone to have depression [15]. SES are vital determinants of human behavior and functioning across the lifespan, including mental health. The SES determinants of health, such as income and education, emerged as significant variables for adverse health outcomes. Nearly half of US adults have a lack of mental health education, and lack the skill to successfully obtain, process, and comprehend health information [16]. Several studies have recognized that people with higher education experience less depression than lower educated people [17,18]. People with low income are also vulnerable of having depression, which is mostly stress-related and caused by monetary pressure, resulting distresses about the future, and negative perceptions associated with low income-related complications [19-21].
Therefore, further studies are needed to examine the association of SES with depression from a nation wide sample in the US. The purpose of this study was to determine the prevalence of depression among the US adult general population and to examine the magnitude of SES association with depression amid this population.
Method
Study Population
In this study, data were extracted from the National Health and Nutrition Examination Survey (NHANES) 2015- 2016, which is a large cross sectional survey design and uses a complex, multistage probability. It attains a representative sample of the US civilian, noninstitutionalized population. Participants were visited in their homes and completed an interviewer administered questionnaire. Also, a subsample attended a specifically designed mobile examination center to undertake a physical examination [22]. The National Center for Health Statistics Ethics Review Board approved the protocols. The questionnaire was administered by trained household interviewers using the computer-assisted personal interviewing (CAPI) method, and participants under went the medical examination part in the mobile examination clinics (MECs), which are traveling clinics. Each MEC comprises of four 52-footlong trailers. Three MECs travelled across the country to randomly selected destinations, with two in operation and one being set up at any given time. Details about the approaches can be found at http:// www.cdc.gov/nchs/nhanes.htm [23].
Measurements
Depression
Depression was assessed using the PHQ-9, which is a 9-item screening tool that asks participants to choose 1 to 4 responses about the frequency of depression during the previous two weeks. If a participant had total PHQ-9 ≥ 10, the person is considered having depression. This definition is equivalent to depression/clinical depression/major depression [24]. PHQ-9 has an overall sensitivity of 88%, a specificity of 88% [25].
Demographics
White, African American and Hispanic (both Mexican and nonMexican Hispanic) were included in this analysis. Age was divided into 18years to 55 years (younger age group) and >55 years (older age group). Both men and women were included in the study. Relationship status has been regarded as married, widowed/divorced/ separated, never married, and individuals living with a partner.
Socio-economic characteristics
SES was measured by education and the family poverty to income ratio (PIR), which is based on a comparison of family income with the poverty threshold determined by the U.S. Bureau of Census. The Census Bureau uses a set of money income thresholds that differ by family size and age of members and arrangement to determine who is in poverty. When a family's total income is less than the family's threshold, then the family and every person in it are considered in poverty [26]. For example, if PIR is less than 1, family's income is considered below the poverty threshold; if PIR is one, the family’s income at the poverty level, and if PIR greater than one then the family’s income considered above the poverty line. In NHANES, education was classified as less than 9th grade, 9th-11th grade (includes 12th grade and no diploma), high school graduate/GED, some college or associates of arts degree, and college graduate or higher.
Statistical Analyses
During this study, the sample data were analyzed using SAS (version 9.2; SAS Institute, Cary, NC, USA). Proc survey frequency (weighted frequency), Rho Chi-square test, and multivariate survey logistic regression were used due to the complex survey design of NHANES. Due to the complex survey design of NHANES, Proc survey frequency was used to get both unweighted and weighted frequency. Weights are created in NHANES data set for each person to account for the survey over sampling, non-response, and poststratification so that variables represent the findings in the U.S. civilian non-institutionalized population [27]. The Odds Ration (OR) and 95% CI were calculated using proc survey multivariate logistic regression. For this study, we categorized PIR into three groups as low (0 to 1.36), medium (1.37 to 4.99), and high (5 and above). Education was categorized into four groups: up to 11th grade, high school/ GED,some college or associate of arts degree (AA), and college graduate or above.
Results
Table 1 shows the characteristics of the US adult population from NHANES (2015-2016). The sample (n = 5,164) consisted of 15.23% Hispanic, 64.71% White, 11.24% African American and 8.81% other race. There were 48.66% men and 51.34% women. Participants were divided between 18 to 55 years old (63.00 %) and > 55 years old (36.99 %) into two age groups.13.93% people completed up to 11th grades with no diploma, 20.93% people completed high school/ GED, 33.01% graduated from some college or associate of arts degree, and 32.13% graduated from college or above. Among the sample, 54.50% of people were married, 18.09% widowed/ divorced/ separated, 17.62% were never married, and 9.79% were living with partners. 26.02% belonged to low PIR, 47.29% in medium PIR, and 26.69% in high PIR. 92.53% of people were not depressed, and 7.47% of people were depressed.
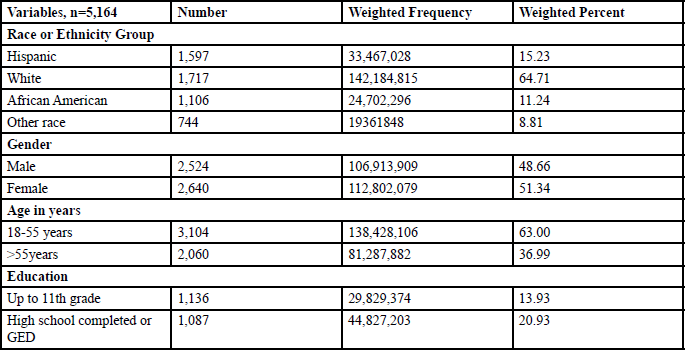
Table: 1 Characteristics of US Adult Population from NHANES, 2015-2016.
As shown in Table 2,7.97% Hispanic, 8.07% African American, 7.32% white people and 6.96% other race had depression (p = 0.91). The prevalence of depression was 5.55% among men and 9.30% among women (p < 0.0001). 7.40% of people in the younger age group had depression, whereas 7.61% in the older age group had depression (p = 0.81). Depression prevalence varied with educational status. Among the four groups educational status, 11.47% of people who completedup to 11th grade had depression, 8.87% of people who finished high school or GED had depression, 8.04% of people who completed some college or associate of arts degree had depression, and 4.29% of people who graduated from college or above had depression (p <0.0001). According to marital status, 4.63% married, 12.45% widowed/divorced/separated, 10.49% people who were never married, and 8.82% people who lived with a partner were depressed (p < 0.0001). PIR had a significant association with depression. Among the low, medium, and high ratio of PIR, 13.47%, 6.56%, and 3.18% of people are depressed, respectively (p < 0.0001).
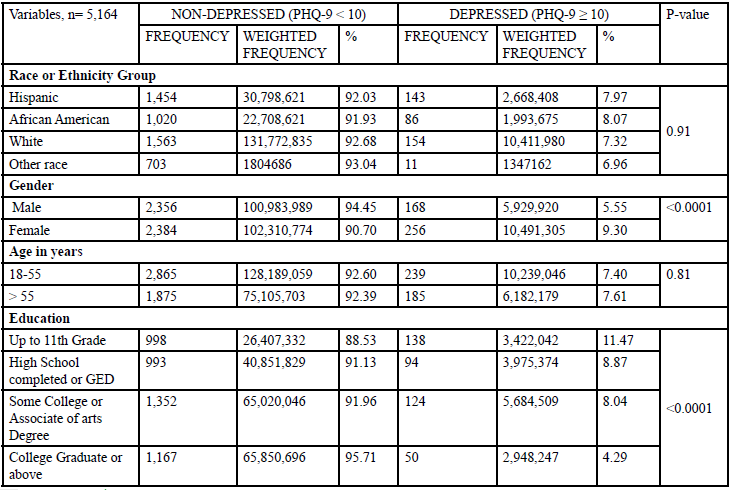
Table: 2 Depression Status of US Adult Population from NHANES, 2015-2016 byDemographics and SES.
Table 3 displayed the significant parameter estimate with an adjusted OR for depression from a multivariate survey logistics regression model. In this multivariate model, we included gender, education, PIR, and marital status which were significant in bivariate model. The OR of depression among females was 1.73 times higher (95% CI: 1.30, 2.31) compared to males. Level of education and marital status were not significantly associated with depression, with an exception that married people had a protective effect as compared to people living with a partner (95% CI: 0.46, 0.93). In terms of PIR, the OR of having depression among people with low PIR was 2.98 times higher (95% CI: 1.58, 5.60) compared to people with high PIR.
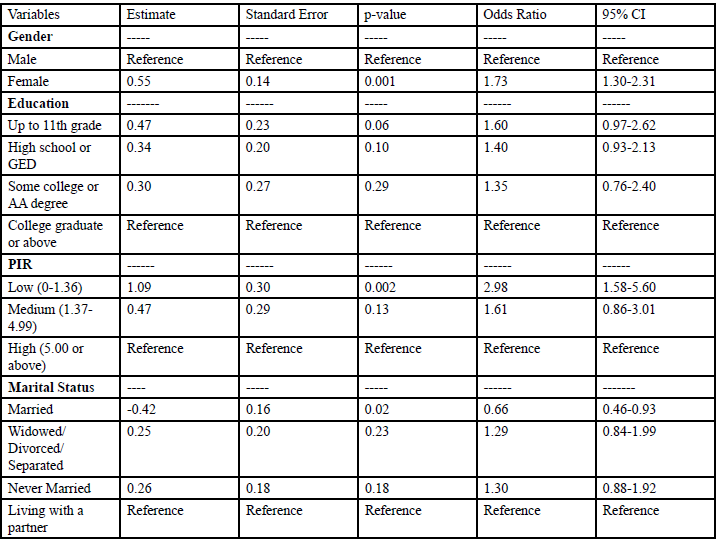
Table: 3 Predictors of Depression Status of US Adult Population from NHANES, 2015-2016.
Discussion
In our study, the prevalence of depression was 2.98 times higher among people with low PIR compared to high PIR, 1.73 times higher among females compared to males, and married people were 0.66 times less likely to have depression compared to people living with partners. This study supports the association of higher SES in terms of higher PIR with better mental health controlling for gender, education and marital status. Although previous studies have shown that both PIR and education were a significant predictor of depression [17-21], we showed that high PIR is independently associated with odds of lower depression controlling for gender, education, marital status.
High income improves access to healthcare services because of healthcare insurance coverage that follows employment. High SES also increases population access to money-oriented resources and facilities, such as a healthy diet and safe residence [19-21,28,29]. High SES is shown to reduce the possessions of a wide range of stressors, including but not necessarily limited to poverty [30]. These processes are very important for good mental health and a better society.
With regards to gender, previous studies have shown that women are more susceptible to have depression than men [31,32]. We also found that there was a significantly higher prevalence of depression among women than men (9.30% vs. 5.55%, p<0.0001).
While marital status was not our focus to test the hypothesis, it generated a hypothesis for future studies. It is observed that people who are married have a significantly lower risk of having depression [33]. Being married had a 34% lower risk of depression compared to individuals living with partners, which is consistent with a previous study [33]. Future studies are needed to examine whether marital status and depression are modified by age and gender [34].
Strengths
Our study is a population-based national study with a large representative sample of the US adult non-institutionalized residents comprising of 219,715,988 population. It utilized a validated and reliable tool (PHQ-9 questioner) for assessing depression (15). It also employed a rigorous analytical method and SES indicators that measure different aspects of socio-economic disadvantages in the US population.
Limitations
It is possible that individuals who screened negative on the NHANES by PHQ-9 score under reported depression, either because of recall bias or additional issues (e.g., stigma or humiliation associated with having a mental illness). Depression was self-reported in this study. Our dependence on cross-sectional data limits our capability to assess the causal relationship between SES and mental health.
Conclusion
In conclusion, we observed that lower income group and female gender are highly associated with depression. Given the high prevalence of depression in the general population, primary care practitioners, public health care professionals, and policy makers should monitor special populations such as females, and people with with low PIR to alleviate the problem of depression. People with these categories having depression should report and use mental health services and psychiatric medications more frequently if necessary.
Author Contributions
Conceptualization, A.R.B.; methodology, A.R.B.; formal analysis, A.R.B.,and N.K.; writing—original draft preparation, A.R.B., and N.K.; writing—review and editing, N.K., A.R.B., M.P., A.K.M.
Funding
This research received no external funding.
Acknowledgments
The authors are thankful to Lauren Turner, Jackson State University, School of Public Health Librarian, for her assistance with the initial literature search, reviewers and editor who assisted in the critical review of this study
Conflicts of Interest
The authors declare no conflict of interest.
References
Lepine, J.P., & Briley, M. (2011). The increasing burden of depression. Neuropsychiatric Dis Treat; 7:3-7.View
Onitilo, A.A., Nietert, P.J, Egede, L.E. (2006). Effect of depression on all-cause mortality in adults with cancer and differential effects by cancer site. Gen Hosp Psychiatry 28:396–402.View
Qian, J., Simoni, W.L., Langenberg, P., Rattinger, G.B., & Zuckerman, I.H.(2013). Effects of depression diagnosis and antidepressant treatment on mortality in Medicare beneficiaries with chronic obstructive pulmonary disease. J Am Geriatrics Soc 61:754-761.
Semenkovich, K., Brown, M.E., Svrakic, D.M., & Lustman, P.J. (2015) Depression in type 2 diabetes mellitus: prevalence, impact, and treatment Drugs 75:577-587.View
Brody, D.J., Pratt, L.A., & Hughes, J.P. (2018). Prevalence of Depression Among Adults Aged 20 and Over: United States, 2013-2016. NCHS data brief 1-8.View
Ustun, TB., Ayuso-Mateos, J.L., Chatterji, S., Mathers, C., & Murray CJ, et al. (2004) Global burden of depressive disorders in the year 2000. Br J Psychiatry 184:386-392. View
Compton, W.M., Conway, K.P., Stinson, F.S., & Grant, B.F. (2006) Changes in the prevalence of major depression and comorbid substance use disorders in the United States between 1991-1992 and 2001-2002. Am J Psychiatry 163:2141-2147.View
Hidaka, B.H. (2012). Depression as a disease of modernity: explanations for increasing prevalence. J Affect Disord, 140: 205-214. View
Birnbaum, HG., Kessler, RC., Kelley, D., Ben-Hamadi, R., & Joish, V. N. et al. (2010) Employer burden of mild, moderate, and severe major depressive disorder: mental health services utilization and costs, and work performance. Depress Anxiety 27: 78-89.View
Pratt, L.A, & Brody, D.J. (2008). Depression in the United States household population, 2005-2006. NCHS Data Brief 1-8.View
Office of Disease Prevention and Health Promotion. Mental Health and Mental Disorders.
Andrade, L., Caraveo-Anduaga, J.J., Berglund, P., Bijl, R., Kessler, R. C, et al. (2000). Cross-national comparisons of the prevalences and correlates of mental disorders. Bulletin of the World Health Organization 78: 413-425.
Muntaner, C., Eaton, W.W., Miech, R., O’campo, P. (2004). Socioeconomic position and major mental disorders. Epidemiologic reviews 26: 53-62.View
Jo, S.J., Yim, H.W., Bang, M.H., Lee, M.O., Jun, T.Y., et al. (2011).The association between economic status and depressive symptoms: an individual and community level approach. Psychiatry investigation 8:194.View
Lorant, V., Croux, C., Weich, S., Deliège, D., Mackenbach, J. et al. (2007). Depression and socio-economic risk factors: 7-year longitudinal population study. Brit J psychiatry 190: 293-298.View
Stewart, D.W., Reitzel, L.R., Correa-Fernandez, V., Cano, M.A., Adams, C.E. et al. (2014). Social support mediates the association of health literacy and depression among racially/ethnically diverse smokers with low socioeconomic status. J Behav Med 37: 1169-1179.View
Bauldry, S. (2015). Variation in the protective effect of higher education against depression. Society and mental health 5: 145- 161. View
Bjelland, I., Krokstad, S., Mykletun, A., Dahl, A.A., Tell, G.S. et al. (2008). Does a higher educational level protect against anxiety and depression? The HUNT study. Social science & medicine, 66: 1334-1345.View
Osafo Hounkpatin, H., Wood, A.M., Brown, G.D., Dunn, G. (2015). Why does Income Relate to Depressive Symptoms? Testing the Income Rank Hypothesis Longitudinally. Soc Indic Res 124: 637-655.View
Wood, A.M., Boyce, C.J., Moore, S.C., Brown, G.D. (2012) An evolutionary based social rank explanation of why low income predicts mental distress: a 17-year cohort study of 30,000 people. J Affect Disord 136: 882-888. View
Zimmerman, F.J., Katon, W. (2005). Socio-economic status, depression disparities, and financial strain: what lies behind the income-depression relationship? Health Econ 14: 1197-1215.View
Maher, C.A., Mire, E., Harrington, D.M., Staiano, A.E., Katzmarzyk, P.T .(2013). The independent and combined associations of physical activity and sedentary behavior with obesity in adults: NHANES 2003-06. Obesity (Silver Spring), 21:E730-737.View
Centers for Disease Control and Prevention (CDC), National Health and Nutrition Examination Survey.View
Kroenke, K., Spitzer, R.L., Williams, J.B. (2001). The PHQ-9: validity of a brief depression severity measure. J Gen Internal Med 16: 606–613. View
Proctor, B.D., Semega, J.L., Kollar, M.A. (2016). Income and poverty in the United States: 2015. Washington, DC: United States Census Bureau. View
Melchior, M., Goldberg, M., Krieger, N., Kawachi, I., Menvielle, G. et al. (2005). Occupational class, occupational mobility, and cancer incidence among middle-aged men and women: a prospective study of the French GAZEL cohort*. Cancer Causes Control 16: 515-524.View
Center for Disease Control.
Melchior, M., Berkman, L.F., Kawachi, I., Krieger, N., Zins, M. et al. (2006). Lifelong socioeconomic trajectory and premature mortality (35-65 years) in France: findings from the GAZEL Cohort Study. J Epidemiol Community Health, 60: 937-944.View
Montez, J.K., Hummer, R., Hayward, M.D. (2012). Educational attainment and adult mortality in the United States: a systematic analysis of functional form. Demography 49: 315-336.View
Herd, P., Goesling, B., & House, J.S. (2007). Socioeconomic position and health: the differential effects of education versus income on the onset versus progression of health problems. J Health Soc Behav 48: 223-238.View
Williams, D.R., & Earl, T.R. (2007) Commentary: Race and mental health--more questions than answers. Int J Epidemiol 36:758- 760.
Van de Velde, S., Bracke, P., & Levecque, K. (2010), Gender differences in depression in 23 European countries. Cross-national variation in the gender gap in depression. Soc Sci Med 71: 305-313. View
Jang, SN., Kawachi, I., Chang, J., Boo, K., & Shin, H. G et al (2009). Marital status, gender, and depression: analysis of the baseline survey of the Korean Longitudinal Study of Ageing (KLoSA). Social science & medicine 69: 1608-1615. View
Craig, TJ., & Van Natta, P.A. (1979) Influence of demographic characteristics on two measures of depressive symptoms: the relation of prevalence and persistence of symptoms with sex, age, education, and marital status. Archives of General Psychiatry 36:149-154. View