
- About the Journal
- Editorial Board
- Review Process
- Author Guidelines
- Article Processing Charges
- Special Issues
- Indexing
- Current Issue
- Past Issue
 Journal of Public Health Issues and Practices
Journal of Public Health Issues and Practices Volume 3 (2019), Article ID: JPHIP-152
https://doi.org/10.33790/jphip1100152Review Article
Epidemiology of Abnormal Blood Pressure among Children and Adolescents in the United States
Kimberly Y. Z. Forrest*, Ph.D, Adelle M. Williams, Ph.D
Department of Public Health and Social Work, Slippery Rock University of Pennsylvania 1 Morrow Way, Slippery Rock, PA 16057, USA.
Corresponding Author Details: Kimberly Y. Z. Forrest, Department of Public Health and Social Work, Slippery Rock University of Pennsylvania 1 Morrow Way, Slippery Rock, PA 16057, USA. E-mail: kimberly.forrest@sru.edu
Received date: 24th October, 2019
Accepted date: 06th December, 2019
Published date: 10th December, 2019
Citation: Forrest, K.Y.Z., & Williams, A.M. (2019). Epidemiology of Abnormal Blood Pressure among Children and Adolescents in the United States. J Pub Health Issue Pract 3: 152.
Copyright: ©2019, This is an open-access article distributed under the terms of the Creative Commons Attribution License, which permits unrestricted use, distribution, and reproduction in any medium, provided the original author and source are credited
Abstract
Study Purpose: To evaluate the epidemiology of abnormal blood pressure among children and adolescents in the United States.
Methods: This cross-sectional study analyzed the data for children and adolescents age 8-19 years (N=6,077) from three cycles of National Health and Nutrition Examination Survey (NHANES), including year 2011-2012, 2013-2014, and 2015-2016. Abnormal blood pressure was defined as systolic blood pressure ≥120 mm Hg or diastolic blood pressure ≥80 mm Hg. Weighted data were used for better population representation. Prevalence rate of abnormal blood pressure was determined by different population characteristics.
Results: There were 11.7% of the children experienced either abnormal systolic or abnormal diastolic blood pressure. As age increased, both systolic and diastolic blood pressures increased. Systolic blood pressure was higher in boys, while diastolic blood pressure was higher in girls. Black children revealed the highest prevalence rate of abnormal blood pressure (16.7%). Children from low income families were also more likely to have abnormal blood pressure. The relationship between abnormal blood pressure and body weight status was inconsistent.
Conclusions: Male gender, Black ethnicity, and low income were associated with abnormal blood pressure among children and adolescents. Since childhood high blood pressures contribute to adult hypertension, screening for abnormal blood pressure among high risk children should be underscored in the health promotion and disease prevention efforts.
Key words: Children; Adolescents; Blood Pressure; Hypertension
Introduction
Hypertension, acting as a silent killer, is a common medical condition that affects one of every three adults in the United States [1,2]. This common medical condition is a significant risk factor for cardiovascular disease, including heart disease and stroke, two of the leading causes of death for Americans [3]. However, hypertension may track from childhood to adulthood without noticing [4,5]. With the epidemic of childhood obesity and prevalent sedentary lifestyle due to video games, hypertension in children and adolescents is a growing health concern [6].
Although hypertension has different stages of severity, the new guideline from the American College of Cardiology (ACC) and the American Heart Association (AHA) defined systolic blood pressure greater than 120 mm Hg and/or diastolic blood pressure greater than 80 mm Hg as abnormal [7]. The prevalence of hypertension was 29.0% in the US adult population, 30.2% in men and 27.7% in women [2]. Among individuals 19 years and younger, the estimated prevalence of hypertension was 4.00% [8]. Elevated blood pressure in children is linked to developing adult hypertension [9,10]. Thus, to effectively control hypertension, the focus might need to shift earlier to childhood. With the negative impact from increased sedentary lifestyle and obesity among children and adolescents in recent years, it is necessary to have updated information on the patterns of childhood hypertension. This study evaluated the epidemiology of abnormal blood pressure among children and adolescents in the United States.
Materials and Methods
Design
The data from three cycles of the National Health and Nutrition Examination Survey (NHANES) were combined and analyzed, including 2011-2012, 2013-2014, and 2015-2016. A cross-sectional study design was utilized for evaluating the data. The NHANES is an ongoing cross-sectional survey conducted by the National Center for Health Statistics (NCHS) to monitor the health and nutritional status of the civilian, non-institutionalized U.S. population, and to track the changes over time [11]. The survey consists of an interview and a physical examination. The interview includes demographic, socioeconomic, lifestyle and health-related questions. The examination component involves medical and physiological measurements, and laboratory tests administered by medical personnel. The NHANES uses a stratified multistage probability sampling design and constructs sample weights to produce nationally representative data. The NHANES data are available in the public domain.
Sample
Blood pressure was measured for ages 8 years or older in all three NHANES cycles. The current analyses included the participants who had valid blood pressure measures and age between 8 – 19 years to reflect children and adolescents in the United States. The current study population was composed of 1,932 children from the 2011- 2012 cycles, 2,111 children from the 2013-2014 cycles, and 2,034 children from the 2015-2016 cycles. The sample of the current study combined the children from the three cycles (N = 6,077).
Measures
Age was recoded into 2-year age groups: 8-9, 10-11, 2-13, 14-15, 16-17, and 18-19 (years). Family income was classified into three categories: <$35,000, $35,000-$74,999, and ≥ $75,000. Body mass index (BMI) was calculated as weight in kilograms divided by height in meters squared. The age- and sex-specific percentiles of the 2000 CDC growth charts [12] were used to categorized children’s weight status: at or above 85th to less than 95th BMI percentiles as overweight, and at or above 95th BMI percentiles as obese.
Blood pressure measurements were taken from participants aged 8 years or older in the NHANES mobile examination center. Individuals with any skin problems on both arms, such as rashes, open sores or wounds, were excluded from the blood pressure measurement. After participants were seated for 5 minutes, three consecutive systolic and diastolic blood pressure readings were obtained, and the second reading was used in the current analysis since it yielded the largest sample size. Abnormal blood pressure was defined as systolic blood pressure ≥120 mm Hg or diastolic blood pressure levels ≥80 mm Hg [7].
Analysis
Data analysis was performed using SAS release 9.3 (SAS Institute Inc., Cary, NC). Due to the national survey nature of NHANES, SAS survey procedures were used to account for the complex multistage sample design. All analyses were based on weighted data to adjust for the differential probabilities of selection, nonresponse, and noncoverage in order to make the data better representative of the U.S. population. These adjustments were made by incorporating the NHANES sample weights into the estimation process. Prevalence rates of abnormal blood pressures were calculated using these sample weights to provide estimates for the population parameters. Specific prevalence rates for different population characteristics were examined for significance by a Chi square test. Gender-specific population means were estimated and compared for blood pressure differences, and the significance was evaluated by a t-test. The significance level was set at the p < 0.05.
Results
Included in this study were the 6,077 NHANES participants age between 8 – 19 years with valid blood pressure measures. Gender distribution is about equal. Age distribution showed a similar proportion across different age groups. Slightly over half of the study participants were Caucasians. Approximately one third of the children came from a family with an annual income < $35,000. The majority of the children had a normal weight status according to their age and gender, while 8.7% were classified as overweight and 9.8% as obese. Abnormal systolic blood pressure was observed among 11.0% of the children, abnormal diastolic blood pressure was observed among 1.7% of the children, and 11.7% of the children experienced either abnormal systolic or diastolic blood pressure (Table 1).
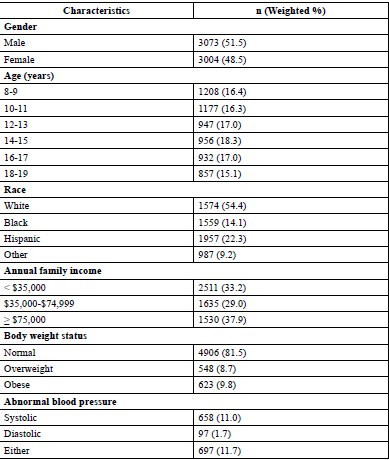
Table: 1 Characteristics of the Study Population (N= 6,077)
Table 2 shows the mean systolic and diastolic blood pressure by age group and gender. The mean systolic blood pressure (mmHg) was 108.7 (95% CI = 108.1 - 109.2) for boys and 104.5 (95% CI = 103.9 - 105.0) for girls (p-value < 0.001). The mean diastolic blood pressure (mmHg) was 57.6 (95% CI = 56.7 - 58.4) for boys and 59.1 (95% CI = 58.2 – 60.0) girls (p-value < 0.01). Boys had a higher systolic pressure than girls for all ages, and the difference was statistically significant for ages 10 and older. However, for diastolic blood pressure, girls displayed a higher measure than boys except for ages 18 - 19, and the difference was statistically significant for ages12 – 17. Figure 1 shows the prevalence rate of abnormal blood pressure (either systolic or diastolic) by age group and gender. As age increased, both systolic and diastolic blood pressures increased in boys and girls (p-value < .001), and this trend was even more obvious for boys, whose rate raised from 3.3% in ages 8 – 9 to 34.7% in ages 18 – 19. Between ages 10 – 13, girls had a higher prevalence rate of abnormal blood pressure than boys; however, after age 13, boys had a higher rate than girls. When examining the changes for the prevalence rate of abnormal blood pressure over study time, there was a significant drop from year 2012 to year 2014 in both genders; however, the rate increased from years 2014 to 2016 in both genders (Figure 2).
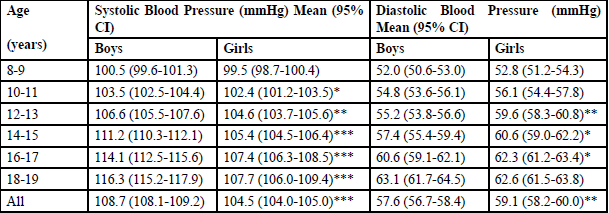
Table: 2 Mean Blood Pressure by Age and Gender
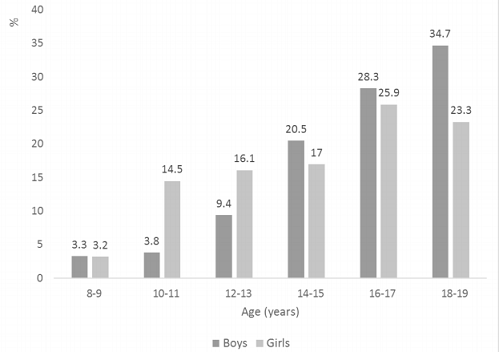
Figure: 1 Prevalence Rate of Abnormal Blood Pressure by Age and Gender
The prevalence rate of abnormal blood pressure (either systolic or diastolic) was evaluated by certain demographic variables and body weight status in Table 3. Boys had a higher prevalence rate of abnormal blood pressure than girls (16.2% vs. 7.0%, p-value < .0001). Black children revealed the highest prevalence rate of abnormal blood pressure (16.7%), while white children exhibited the lowest (10.0%). Children from families with an annual income less than $35,000 were most likely to have abnormal blood pressure (13.8%), and children from families with an annual income of $75,000 or more were least likely to have abnormal blood pressure (10.0%). The prevalence rate of abnormal blood pressure was 11.7% among children with a normal body weight status, 9.0% among overweight children, and 13.9% among obese children, although the difference was not statistically significant.
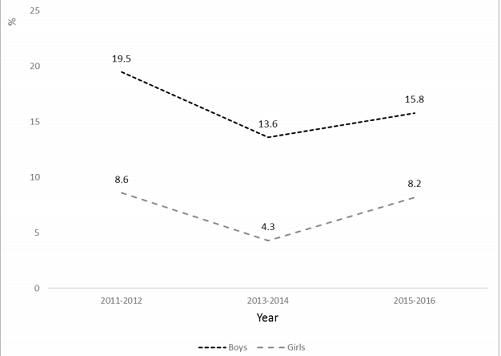
Figure: 2 Changes in Prevalence Rate of Abnormal Blood Pressure by Gender and Year
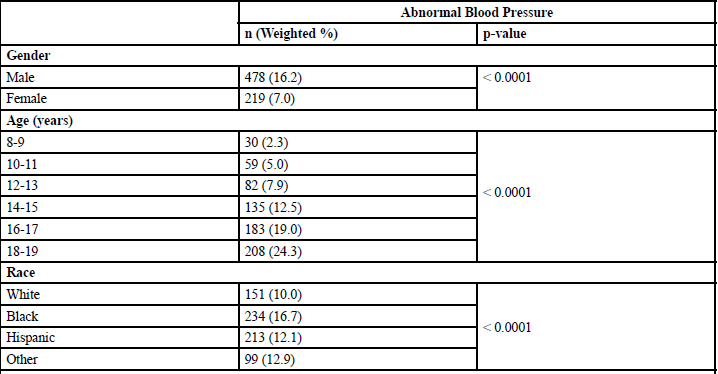
Table: 3 Prevalence Rate of Abnormal Blood Pressure by Different Factors
Discussion and Conclusion
Blood pressure increased as age increased in both boys and girls, and the trend was steeper in boys than in girls. The prevalence rate of abnormal blood pressure was more than doubled in boys than in girls, especially for systolic blood pressure. Black children and adolescents were more likely to experience abnormal blood pressure. Family income was negatively associated with blood pressure. Overweight and obesity were not found to be correlated with blood pressure in the current study.
In the United States, the prevalence rate of abnormal blood pressure was decreased among children and adolescents during 2011 – 2014; however, the trend reversed between 2014 – 2016 in both boys and girls. The previous NHANES data showed an increased blood pressure during years of 1988 – 2000 [13] and decreased blood pressure during 1999 – 2012 among U.S. children and adolescents [14]. Increased blood pressure was also observed among children in the United Kingdom during years 1980 – 2008 [15] and among Chinese children during years of 2005 – 2010 [16,17]. There was a lack of more recent population-based trends of abnormal blood pressure among children and adolescents. Some studies correlated the increased blood pressure in children with the increased prevalence of overweight and obesity [13,16,18,19]; nonetheless, other studies did not find an association between the two factors [15,16]. Roulet, et al reported a systematic review on the trends of the childhood blood pressure changes from 13 high-income countries and 5 middle-income countries, and blood pressure was observed to be decreased in 13 studies, increased in four, and did not change in one between 1963 and 2012 [20]. Based on the data, Roulet, et al suggested that the trends of blood pressure did not mirror the trends in overweight among children. This study also failed to establish a relationship between abnormal blood pressure and weight status in the study population. Many studies, including the current study, used BMI to classify weight status; however, body composition may not be accurately reflected by BMI, especially among children and adolescents [21]. BMI is based on the finding that adult body weight is proportional to height squared. For post pubescent individuals, weight is not proportional to height squared. This fact could affect the validity of BMI implication in adolescents, therefore wash out the effect of BMI on blood pressure.
This study found that boys had a higher prevalence rate of abnormal blood pressure than girls, and the difference was more significant for ages 14 years or older. The gender difference in the prevalence of hypertension was also observed in adults [22]. The mechanisms for the gender-specific difference in the development of hypertension are not completed understood; however, hormonal differences, such as estrogen and androgens, appear to play a role [23]. Women younger than 45 years old are less likely to have hypertension than men; however, the difference is diminished after menopause [24]. The increased prevalence of abnormal blood pressure among boys after ages 14 years might also be related to the sex hormone changes after puberty.
Compared to their white counterparts, Black children and adolescents had 67% increased risk to have an abnormal blood pressure in this study population. Such a race difference in the prevalence of hypertension was also shown in adults. In the United States, 43% Black men and 45.7% Black women suffer from hypertension compared to the national average of 34.1% in men and 32.7% in women [24]. Furthermore, it was reported that high blood pressure develops earlier in life among Blacks [25]. Some explanations for a higher prevalence rate of hypertension among Blacks included higher rates of obesity and diabetes in the ethnic group [26,27]. Studies also found that there might be a genetic factor that makes Blacks much more susceptible to the condition [28,29].
In the current study, we found that children and adolescents from low income families were more likely to have an abnormal blood pressure measure. Family income could be used as an estimate of social economic status, which might reflect lifestyles. Some lifestyle factors, such as physical inactivity and unhealthy eating habits, are critical determinants of blood pressure levels [30,31]. Due to the lack of data related to physical activity and dietary measures for the age groups in the study population, these two important factors associated with blood pressure were not evaluated. Nevertheless, finding a link between abnormal blood pressure and family income supported the evidence that social economic status could influence blood pressure, and similar findings have been revealed over decades of research [32-34].
There are some limitations recognized in this study. National High Blood Pressure Education Program Working Group recommended to define childhood hypertension based on the normative distribution of blood pressure in healthy children [35]; however, the current study defined abnormal blood pressure as systolic blood pressure ≥120 mmHg or diastolic blood pressure levels ≥80 mmHg [7]. Using these cutoff points to identify children and adolescents with abnormal blood pressure might be more practical for the public to use and to implicate intervention and treatment. Potential selection bias might be existed due to missing values for blood pressure measures. The available data were not able to identify hypertension as primary or secondary. Family history of hypotension is a significant risk factor for developing high blood pressure; however, this factor was not evaluated in the current study due to data limitation.
In conclusion, abnormal blood pressure among children and adolescents was associated with certain demographic variables, such as male gender, Black ethnicity, and low income. Since childhood hypertension contributes to adult hypertension, and hypertension contributes to cardiovascular disease - the leading cause of death in populations, it is cost-effective to screen blood pressure among high risk children and adolescents, as measuring blood pressure is a simple procedure to be applied, and early treatment for hypertension is effective.
Acknowledgments
None
Conflicts of Interest (COI) Statement
The authors of this study have not received any funding for the research, and do not have any competing interests or conflicts of interest. Since this study analyzed the public domain data from the Centers for Disease Control (CDC) without any individual identification, ethical approval was not required.
References
Merai, R., Siegel, C., Rakotz, M., Basch, P., Wright, J. et al. (2016). CDC Grand Rounds: A Public Health Approach to Detect and Control Hypertension. MMWR Morb Mortal Wkly Rep 65: 1261-1264.View
Yoon, S.S., Carroll, M.D., & Fryar, C.D. (2015). Hypertension Prevalence and Control Among Adults: United States, 2011-2014. NCHS Data Brief Nov 1-8.View
Kochanek, K.D., Xu, J., Murphy, S.L., Miniño, A.M., Kung, H.C. et al. (2011) Deaths: final data for 2009. Natl Vital Stat Rep 60: 1-116.View
Elkasabany, A.M., Urbina, E.M., Daniels, S.R., & Berenson, G.S. (1998). Prediction of adult hypertension by K4 and K5 diastolic blood pressure in children: The Bogalusa Heart Study. J Pediatr 132: 687-92.View
Magnussen, C.G., & Smith, K.J. (2016). Pediatric Blood Pressure and Adult Preclinical Markers of Cardiovascular Disease. Clin Med Insights Blood Disord 9: 1-8.View
Riley, M., Hernandez, A.K., & Kuznia, A.L. (2018). High Blood Pressure in Children and Adolescents. Am Fam Physician 98: 486-494.View
Flynn, J.T., Kaelber, D.C., Baker-Smith, C.M., Blowey, D., Carroll, A.E., et al. (2017) Clinical Practice Guideline for Screening and Management of High Blood Pressure in Children and adolescents. Pediatr 140: 1904.View
Song, P., Zhang, Y., Yu, J., et al. (2019). Global Prevalence of Hypertension in Children: A Systematic Review and Metaanalysis. JAMA Pediatr. Published online October 07, 2019.View
Juhola, J., Magnussen, C.G., Viikari, J.A., Kähönen, M., Hutri- Kähönen, N., et al. (2011). Tracking of serum lipid levels, blood pressure, and body mass index from childhood to adulthood: The Cardiovascular Risk in Young Finns Study. The J Pediatr 159: 584-590.View
Toschke, A.M., Kohl, L., Mansmann, U., & von Kries, R. (2010). Metaanalysis of blood pressure tracking from childhood to adulthood and implications for the design of intervention trials. Acta Paediatr 99:24-9.View
Johnson, C.L., Dohrmann, S.M., Burt, V.L., & Mohadjer, L.K. (2014). National health and nutrition examination survey: sample design, 2011-2014. Vital Health Stat 2: 1-33.View
Kuczmarski, R.J., Ogden, C.L., Guo, S.S., Grummer-Strawn, L.M., Flegal, K.M., et at. (2002) 2000 CDC Growth Charts for the United States: Methods and Develop 246: 1-190.View
Muntner, P., He, J., Cutler, J.A., Wildman, R.P., Whelton, P.K., et al. (2004) Trends in blood pressure among children and adolescents. JAMA 291: 2107-13.View
Xi, B., Zhang, T., Zhang, M., Liu, F., Zong, X., et al. (2016). Trends in Elevated Blood Pressure Among US Children and Adolescents: 1999-2012. Am J Hypertens 29: 217-25.View
Peters, H., Whincup, P.H., Cook, D.G., Law, C., Li, L., et al. (2012). Trends in blood pressure in 9 to 11-year-old children in the United Kingdom 1980-2008: the impact of obesity. J Hypertens 30: 1708-17.View
Dong, B., Wang, H.J., Wang, Z., Liu, J.S., Ma, J., et al. (2013). Trends in blood pressure and body mass index among Chinese children and adolescents from 2005 to 2010. Am J Hypertens 26: 997- 1004.View
Kwok, M.K., Tu, Y.K., Kawachi, I., & Schooling, C.M. (2017). Ageperiod- cohort analysis of trends in blood pressure and body mass index in children and adolescents in Hong Kong. J Epidemiol Commu Health 71: 1161-1168.View
Kelly, R.K., Magnussen, C.G., Sabin, M.A., Cheung, M., Juonala, M., et al. (2015) Development of hypertension in overweight adolescents: a review. Adolesc Health Med Ther 6: 171-87.View
Sukhonthachit, P., Aekplakorn, W., & Hudthagosol, C., Sirikulchayanonta, C. (2014). The association between obesity and blood pressure in Thai public school children. BMC Public Health 14: 729.View
Roulet, C., Bovet, P., Brauchli, T., Simeoni, U., Xi, B., et al. (2017). Secular trends in blood pressure in children: A systematic review. J Clin Hypertens 19: 488-497.View
Peterson, C.M., Su, H., Thomas, DM., et al. (2017). Tri-Ponderal Mass Index vs Body Mass Index in Estimating Body Fat During Adolescence. JAMA Pediatr 171: 629–636.View
Kornitzer, M., Dramaix, M., De acker, G. (1999). Epidemiology of risk factors for hypertension: implications for prevention and therapy. Drugs 57: 695-712.View
Roberts, C.K., Vaziri, N.D., & Barnard, R.J. (2001). Protective effects of estrogen on gender-specific development of diet-induced hypertension. J Appl Physiol 91: 2005-9.View
Mozaffarian, D., Benjamin, E.J., Go, A.S., Arnett, D.K., Blaha, M.J., et al. (2015). Heart disease and stroke statistics--2015 update: a report from the American Heart Association. Circulation 131: e29-322.View
American Physiological Society. (2008). Hypertension Develops Early, Silently, In African-American Men. Science Daily.View
Ogden, C.L., Carroll, M.D., Kit, B.K., & Flegal, K.M. (2014). Prevalence of childhood and adult obesity in the United States, 2011-2012. JAMA 311: 806-14.View
Spanakis, E.K., & Golden, S.H. (2013). Race/ethnic difference in diabetes and diabetic complications. Curr Diab Rep 13: 814-23.View
Wilson, D.K., & Ampey-Thornhill, G. (2001). The role of gender and family support on dietary compliance in an African American adolescent hypertension prevention study. Ann Behav Med 23: 59-67.View
Bloem, L.J., Manatunga, A.K., & Pratt, J.H. (1996). Racial difference in the relationship of an angiotensin I-converting enzyme gene polymorphism to serum angiotensin I-converting enzyme activity. Hypertens 27: 62-6.View
Beilin, L.J., Puddey, I.B., & Burke, V. (1999). Lifestyle and hypertension. Am J Hypertens 12: 934-945.View
Appel, L.J. (2003). Lifestyle Modification as A Means to Prevent and Treat High Blood Pressure. J Am Soc Nephrol 14: S99-S102.View
Winkleby, M.A., Jatulis, D.E., Frank, E., & Fortmann, S.P. (1992). Socioeconomic status and health: how education, income, and occupation contribute to risk factors for cardiovascular disease. Am J Public Health 82: 816-20.View
Conen, D., Glynn, R.J., Ridker, P.M., Buring, J.E., Albert, M.A., et al. (2009) Socioeconomic status, blood pressure progression, and incident hypertension in a prospective cohort of female health professionals. Eur Heart J 30: 1378-84.View
Paulsen, M.S., Andersen, M., Munck, A.P., Larsen, P.V., Hansen, D.G., et al. (2012). Socio-economic status influences blood pressure control despite equal access to care. Fam Pract 29: 503-10.View
National High Blood Pressure Education Program Working Group on High Blood Pressure in Children and Adolescents (2004) The fourth report on the diagnosis, evaluation, and treatment of high blood pressure in children and adolescents. Pediatrics 114: 555-76.View