
- About the Journal
- Editorial Board
- Review Process
- Author Guidelines
- Article Processing Charges
- Special Issues
- Indexing
- Current Issue
- Past Issue
 Journal of Public Health Issues and Practices
Journal of Public Health Issues and Practices Volume 4 (2020), Article ID: JPHIP-169
https://doi.org/10.33790/jphip1100169Research Article
A West Texas County Food Insecurity Survey Findings
Jay Brown1*, Floyd Huang, PhD2 , Ji’ Lynda Brown, MPH, MEd1
1 Department of Health Science Professions, Angelo State University, Texas Tech University System, ASU Station #11057, United States
2 Associate Professor, Department of Physical Therapy, Angelo State University, United States.
Corresponding Author Details: Dr. Jay Brown, Assistant Professor, Department of Health Science Professions, Angelo State University, Texas Tech University System, ASU Station #11057, San Angelo, TX 76909-1057, United States E-mail: jay.brown@angelo.edu
Received date: 27th August, 2020
Accepted date: 06th September, 2020
Published date: 08th October, 2020
Citation: Brown, J., Huang, F., & Brown, J.L. (2020). A West Texas County Food Insecurity Survey Findings. J Pub Health Issue Pract 4(2):169.
Copyright: ©2020, This is an open-access article distributed under the terms of the Creative Commons Attribution License, which permits unrestricted use, distribution, and reproduction in any medium, provided the original author and source are credited
Abstract
Despite living in the world’s largest food-producing nation, children and adults face poverty and hunger in every county across America. According to Feeding America [1], more than 38 million Americans are living in poverty. More than 37 million people struggle with hunger in this country, including more than 11 million children. 1 in every 9 Americans are food insecure. The situation is even worse in the state of Texas where 1 in every 7 Texans are food insecure. This makes Texas one of just 15 states with higher food insecurity than the national average [2]. In 2018, The Tom Green County Hunger Coalition (TGCHC) conducted a Food Access Survey (FAS) to help determine areas of need regarding food assistance in the city of San Angelo, Texas. The 328 respondents were divided into two groups (Food Secure and Food Insecure) based on their responses and compared. There were significant differences found between the two groups in regards to their age, household size, housing tenure, access, and assistance.
Background
Despite living in the world’s largest food-producing nation, children and adults face poverty and hunger in every county across America [1]. According to Feeding America, more than 38 million Americans are living in poverty. More than 37 million people struggle with hunger in this country, including more than 11 million children. Children are actually more likely to face food insecurity than any other group in the United States. And now the coronavirus pandemic has left millions of families without stable employment leading to estimates that more than 54 million people, including 18 million children, may experience food insecurity in 2020 [1].
Food security means access by all people at all times to enough food for an active, healthy life. The United States Department of Agriculture (USDA) introduced new language in 2006 to describe ranges of severity of food security. These labels include:
• High food security: no reported indications of food-access problems or limitations.
• Marginal food security: one or two reported indications – typically of anxiety over food sufficiency or shortage of food in the house. Little or no indication of changes in diets or food intake.
• Low food security: reports of reduced quality, variety, or desirability of diet. Little or no indication of reduced food intake.
• Very low food security: reports of multiple indications of disrupted eating patterns and reduced food intake.
“Low food security” and “very low food security” are often categorized under “food insecurity”. Food insecurity is a householdlevel economic and social condition of limited or uncertain access to adequate food [2]. 1 in every 9 Americans are food insecure. The situation is even worse in the state of Texas where 1 in every 7 Texans are food insecure. This makes Texas one of just 15 states with higher food insecurity than the national average.
Data
In 2018, The Tom Green County Hunger Coalition (TGCHC) conducted a Food Access Survey (FAS) to help determine areas of need regarding food assistance in the city of San Angelo, Texas. The data was collected entirely through paper questionnaires completed by the respondents. The questionnaires were distributed primarily at cooperating sites such as Meals on Wheels, Stephens Central Library, Rust Street Ministries, and Alcohol & Drug Abuse Council for the Concho Valley (ADACCV). Some questionnaires were given to nonprofit and service organization representatives at monthly meetings held by MHMR Services of Concho Valley. Those representatives would then take the surveys back to their clients to complete.
A total of 328 San Angelo residents completed the Food Access Survey (FAS). The majority of respondents of the FAS were single (57.3%), age 50 and over (60.6%), and renting their homes (53.2%). The primary area of residence for this population was in North San Angelo (29.2%) and West San Angelo (28.8%). By a large percentage, the population seems to make their shopping choices based first on location (65.2%), then cost (39.4%). The store most frequented was Walmart (66.2%), followed by HEB (41.7%), and Food King (41.2%). The majority of participants (61.8%) selected “close to home” as the reason why they regularly shopped at these stores.
The majority of respondents (75.6%) noted that their meals were primarily prepared at home instead of fast food or takeout or received at church or through community services. Even though fast food was evenly distributed and available across the city (67-76%), respondents residing in North San Angelo reported significantly lower access to low fat foods. Also, while fresh fruits and vegetables were mostly available across the city, respondents residing in North San Angelo reported significantly lower access to high quality fruits and vegetables.
Results
For this study, we divided the respondents of the FAS into two groups based on their response to the questionnaire item: “within the past 12 months, we worried whether our food would run out before we got money to buy more.” Those who answered true (“often true” or “sometime true”) were categorized into the Food Insecure group and those who answered false were categorized into the Food Secure group. These two groups were then compared using the appropriate statistical tests.
There was a significant difference found between the average age of respondents in the two groups. The mean age of respondents in the Food Secure group was 62.6 years, while the mean age of respondents in the Food Insecure group was 49.6 years. Those who were food insecure we approximately 13 years younger on average than those who were food secure. This difference was found to be statistically significant according to an independent samples t-test.
There was a significant difference found between the number of people living in the household between the two groups. The mean number of people living in the household among the Food Secure group was 1.90, while the mean number of people living in the household among the Food Insecure group was 2.78. This shows that on average there was one extra person in the household among those who were food insecure. While there are approximately two people to feed among the food secure households, there are approximately three people to feed among those households that are food insecure. This difference was found to be statistically significant according to an independent samples t-test.
While a statistically significant difference was not found between Household Type among the two groups, it was noticed that respondents in the Food Insecure group were more likely to have children than those in the Food Secure group. Some other interesting findings appeared when the Food Insecure group was compared to all respondents:
• 51.2% of all respondents were single, of which 60% were food insecure.
• 16.8% of all respondents were single with children, of which 64.7% were food insecure.
• 14.2% of all respondents were a couple, of which 44.2% were food insecure.
• 8.6% of all respondents were a couple with children, of which 80.8% were food insecure.
• 5.6% of all respondents were multi-generation, of which 76.5% were food insecure.
• 3.6% of all respondents were grandparents raising grandchildren, of which 54.5% were food insecure.
These findings reinforce prior research suggesting that having more individuals in the household, particularly children, is correlated with an increased likelihood of food insecurity [3-7].
There was a significant difference found between the housing tenure of the two groups. 40.8% of the Food Secure group were homeowners while only 13.0% of the Food Insecure group owned their home. The vast majority (57.8%) of the Food Insecure group were instead renting. Those who were food insecure were also more likely to be homeless at 9.2% compared to 2.5% of those who were food secure.
There were significant differences found in regards to the perception of access between the two groups. Those in the Food Insecure group were more likely to believe that fresh fruits and vegetables were not available to them (34.8%) than those in the Food Secure group (18.3%). The Food Insecure group was also more likely to believe they did not have access to high quality fruits and vegetables (62.1%) as compared to the Food Secure group (46.2%). Finally, the Food Insecure group was more likely to believe that a large selection of low-fat foods was not available to them (60.3%) as compared to the Food Secure group (50.0%).
There were a few significant differences in the type of assistance used between the groups. 61.4% of the respondents in the Food Insecure group used food stamps while only 22.6% of those in the Food Secure group did. 33.7% of the respondents in the Food Insecure group utilized food banks or pantries while only 6.1% of those in the Food Secure group did. Those who are food insecure are clearly more likely to need assistance. However, only 8.7% of the Food Insecure group used an elderly nutrition program compared to 27.0% of the Food Secure group. This might be explained by the Food Insecure group consisting of a younger population than the Food Secure.
Finally, a qualitative analysis was performed to identify the salient needs of the respondents. They were asked “what would make it easier to obtain food?” Figure 1 represents a word cloud denoting the prevalence of their responses.
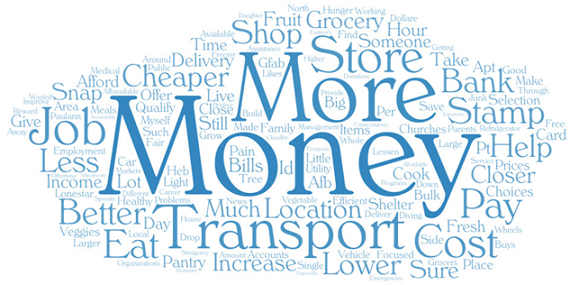
Figure 1.
“Money” was by far the most common answer. Many other responses also tied into financial concerns such as “job,” “pay,” “cheaper,” “prices,” “free,” “afford,” “bills,” and “income.”
“Transport” was also a shared solution denoting an issue with access. “Location,” “delivery,” “area,” and “wheels” all support this response.
When respondents were asked directly about what their needs were, their responses were enlightening. Figure 2 represents a word cloud denoting the prevalence of their responses to this question.
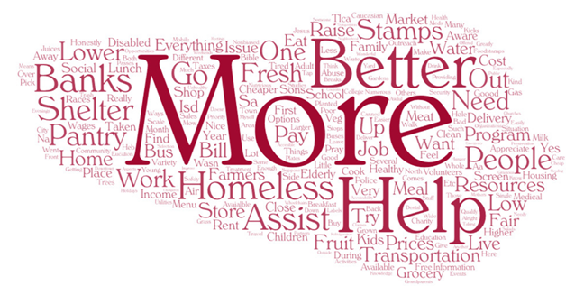
Figure 2.
Respondents said they wanted more help. They needed further assistance and better resources that can supply them with fresh produce. More food banks, food pantries, and shelters were some of the most common answers. These individuals would like better programs that can help with transportation, information, and access to healthy meals.
Recommendations
Based on these findings, there are a number of recommendations that can be made. The population that was found to be most at risk for food insecurity were younger, with children, and renting their homes. Future studies regarding food access should focus more on groups with these demographics. A salient need that was discovered was access. Those who were food insecure felt they lacked access to quality produce. A recommendation can be made to increase funding to programs that increase access through transportation, delivery, or other forms of assistance. Representatives from The Tom Green County Hunger Coalition, Mary Herbert and Kaitlyn Bettin, propose that a mobile food pantry should be instituted in the area. This vehicle can greatly increase access by bring fruits, vegetables, and other foods directly to those in need.
Cost was also another salient concern. Many of those who are food insecure simply cannot afford an adequate sustenance for their household. A final recommendation would be to increase funding to those programs assisting in making the basic need of food more affordable. Food stamps, food pantries, shelters, and farmers’ markets are all vital components of any community.
Conflicts of Interest
The author declare no conflict of interest.
References
Feeding America. (2020). Hunger in America. View
USDA. (2020). Definitions of Food Security. Retrieved April 27, 2020, View
Barrett, C. B. (2010). Measuring food insecurity. Science, 327(5967), 825-828.View
Borjas, G. J. (2004). Food insecurity and public assistance. Journal of Public Economics, 88(7-8), 1421-1443. View
Jensen, H. H. (2002). Food insecurity and the food stamp program. American Journal of Agricultural Economics, 84(5), 1215-1228. View
Morton, L. W., Bitto, E. A., Oakland, M. J., & Sand, M. (2005). Solving the problems of Iowa food deserts: Food insecurity and civic structure. Rural Sociology, 70(1), 94-112. View
Tarasuk, V. S., & Beaton, G. H. (1999). Household food insecurity and hunger among families using food banks. Canadian Journal of Public Health, 90(2), 109-113.View