
- About the Journal
- Editorial Board
- Review Process
- Author Guidelines
- Article Processing Charges
- Special Issues
- Indexing
- Current Issue
- Past Issue
 Journal of Public Health Issues and Practices
Journal of Public Health Issues and Practices Volume 5 (2021), Article ID: JPHIP-185
https://doi.org/10.33790/jphip1100185Research Article
Assessment of Particulate Matter Levels in Homes with Children
Ali Al Rabou1, Christopher Wichman2, Nicole Caputo-Rennels3, & Chandran Achutan1*
1Department of Environmental, Agricultural, and Occupational Health, University of Nebraska Medical Center, College of Public Health, Omaha, Nebraska, 68198. United States.
2Department of Biostatistics, University of Nebraska Medical Center, College of Public Health, Omaha, Nebraska, 68198. United States.
3Omaha Healthy Kids Alliance, Omaha, Nebraska, 68132. United States.
Corresponding Author Details: Chandran Achutan, PhD, CIH, Associate Professor, Department of Environmental, Agricultural, and Occupational Health, University of Nebraska Medical Center, College of Public Health, Omaha, Nebraska, 68198. United States. E-mail: cachutan@unmc.edu
Received date: 27th July, 2021
Accepted date: 18th September, 2021
Published date: 21th September, 2021
Citation:Rabou, A.A., Wichman, C., Caputo-Rennels, N., & Achutan, C. (2021). Assessment of Particulate Matter Levels in Homes with Children. J Pub Health Issue Pract 5(2): 185.
Copyright:©2021, This is an open-access article distributed under the terms of the Creative Commons Attribution License 4.0, which permits unrestricted use, distribution, and reproduction in any medium, provided the original author and source are credited.Creative Commons Attribution License, which permits unrestricted use, distribution, and reproduction in any medium, provided the original author and source are credited
Abstract
Children’s exposure to particulate matter (PM) is of great interest because it can cause adverse health effects, including asthma, and decreased lung function. The purpose of this study was to determine the levels of PM in low socio-economic status homes in Omaha, Nebraska. Between October 2018 and September 2019, we collected ambient air PM samples from 30 homes, of which 70% had at least one asthmatic child. Samples were collected at the 2-foot level and the 4-foot level to approximate the breathing zones of toddlers and older children, respectively. We also asked the study participants questions related to indoor air quality (IAQ). Indoor PM levels ranged from 4.28 to 72.81 μg/m3. There was a significant association between IAQ and the furnace filter status (dirty or clean) (p = 0.023, OR = 7.5 [95% confidence interval: 1.40, 39.84]). We found that IAQ status suggests a significant association with the level of housekeeping (p = 0.05, OR = 4.76 [95% confidence interval: 0.95, 23.86]). Indoor PM levels varied significantly between 2 feet and 4 feet (p < 0.05). PM levels could differ substantially depending on the furnace filter’s status. In addition, exposure to PM can significantly depend on the child’s height.
Key Words: Particulate matter (PM), Indoor air quality (IAQ), Furnace filter, Children’s health, Breathing zone, Socio-economic status (SES).
Introduction
The term of indoor air quality (IAQ) is used to characterize the air quality inside and around buildings. It is of great importance because it can adversely influence the health and comfort of the occupants if not properly controlled [1]. In this day and age, there is an increase of environmental and public concern about IAQ because it has been found that the concentrations of pollutants in the indoor air can be two to five times higher than the outdoor concentrations [2]. Many studies have found that exposure to indoor air contaminants such as particulate matter (PM), carbon monoxide, tobacco smoke, volatile organic compounds (VOCs), and allergens can increase the risk of asthma, eye and nose irritations, sensitization (repeated exposure results in progressive increase of response), and COPD [3,4]. There are many sources of indoor air contaminants such as cleaning products, burning candles, household chemicals, renovation activities, carpets, wallpapers, etc.
Particulate matter (PM) is defined as a mixture of very fine solid or liquid particles suspended in the air. PM may include a number of components including acids, metals, organic chemicals, and dust particles [5]. PM is generated in indoor environments by many activities which may include but are not limited to, cooking, walking on carpets, household pets, household chemicals, and smoking [6,7]. Also, the indoor levels of PM inside homes are influenced by many factors such as flooring material, home’s ventilation, proximity to the main roads, meteorological conditions, age of the building, and by the home’s heating, ventilating, and air conditioning (HVAC) system. These factors can significantly increase the indoor levels of PM compared to outdoor, and many studies have suggested that indoor PM concentrations may exceed the outdoor concentrations if these factors are not controlled properly [8,9].
PM is considered an important indicator of IAQ and household air pollution because it can remain in the air for prolonged periods depending on its size [10]. Exposure to PM is of great concern from an environmental and public health perspective. It has received great interest in the recent years because of the scientific and epidemiological evidence of its adverse effects on human health. The World Health Organization (WHO) has classified PM as the 13th leading cause of death globally [5]. Anderson [5] stated that premature deaths caused by exposure to PM are about 800,000 deaths yearly.
The smaller sizes of PM which include PM less than 10 micrometers (PM10), such as dust, pollen, and mold, and PM less than 2.5 micrometers (PM2.5), such as combustion particles, organic compounds, and metals, termed as inhalable particles, can go deeper in the human’s respiratory system and can pass through the lung to reach the bloodstream. Exposure to these particles can cause many adverse effects on human health, including cardiovascular diseases, chronic respiratory diseases, pneumonia, and chronic obstructive pulmonary disease (COPD) [11,12]. In 2010, the estimated annual premature mortality related to PM2.5 was 3.3 million [13]. Liu et al [14] found that there is a proportionate increase in daily all-cause mortality with higher PM levels. Their study revealed that short term exposure to PM10 and PM2.5 is strongly associated with respiratory and cardiovascular mortality in approximately 652 cities across the world. The WHO recommends a daily PM2.5 limit of less than 25 micrograms per cubic meter (µg/m3)[15].
In general, children are more sensitive to indoor air contaminants and are considered at greater risk of adverse health effects from exposure to PM because their respiratory, central nervous, and defense systems are not as developed as adult systems. They inhale air at quantities greater than those of adults compared to their body weight [16-18], and they tend to spend most of their time (65 % to 90%) indoors [4,19]. Furthermore, it is known that younger children are more physically active than adults and their natural behaviors inside homes such as crawling and playing on carpets could resuspend smaller sizes of PM that fall 1–10 μm range and will generate a greater mass of these particles [20,21]. Therefore, they will be exposed to higher levels of indoor PM compared to older children and adults.
Exposure to smaller sized PM (PM10 and PM2.5) is strongly associated with asthmatic prevalence, hospitalizations, and emergency room visits among children [22]. Long-term exposure to high levels of PM2.5 resulting from vehicle air pollution during early childhood may be associated with increasing risk of asthma development among children (odds ratio = 1.14, 95% confidence interval (CI): 1.00 to 1.30) [23]. Many studies have found that children’s exposure to PM10 and PM2.5 is strongly associated with pneumonia, broncho-pulmonary infections, and may increase the risk of respiratory diseases [24-26]. Also, studies have revealed that exposure to elevated levels of PM2.5 will cause adverse impacts on children’s lung function [27-29]. Chen et al [29] found that exposure to PM2.5 among children aged 6–15 years is positively associated with reduced lung function. Jung et al [30] reported that indoor exposure to high levels of PM2.5 among children between the ages of five and seven years old is significantly associated with the development of wheezing (odds ratio = 1.51, 95% CI: 1.05–2.16).
Indoor PM levels can vary significantly between homes. PM and air pollutants’ levels inside homes can be affected by the socio-economic status (SES), cultural behavior and lifestyle of the families [7,31]. Several studies have investigated PM concentrations in U.S. homes [8,[32-34] but few of these studies investigated PM concentrations in homes of low socioeconomic status families. Lower socioeconomic status families may be exposed to higher concentrations of PM in their homes due to some indoor environmental factors such as inadequate or insufficient ventilation, smoking inside the house, and poor maintenance of HVAC system. Thus, there is a need for more studies regarding determinants of indoor PM levels among these families to improve indoor air quality and reduce PM exposure inside their homes.
Materials and Methods
Study Design
In this cross-sectional study, we collected air PM samples from 30 low socioeconomic homes with children. We also interviewed the study participants and asked them questions related to the indoor environmental factors that affect indoor PM levels and IAQ, such as the replacement of furnace filter, the presence of household pets, the frequency of housekeeping, and smoking inside homes. Our overall research hypothesis was that children are exposed to airborne particulate matter in homes. To address this hypothesis, we developed the following four goals:
1. Determine children’s exposure to PM inside homes.
2. Examine indoor environmental factors that may affect indoor PM levels.
3. Examine the association between indoor environmental factors and the IAQ.
4. Test the difference in PM concentrations at two different heights (2 feet and 4 feet).
Study population and setting
This study recruited low-SES households with asthmatic and non-asthmatic children residing in Omaha city. SES was defined in terms of annual income and the number of residents in the home [35]. Homes were identified by address and zip code. As shown in Figure 1, our samples were collected from ten zip codes: 68104 (2 homes), 68105 (4 homes), 68106 (3 homes), 68107 (9 homes), 68108 (2 homes), 68111 (4 homes), 68112 (3 homes), 68134 (1 home), 68144 (1 home), and 68152 (1 home).
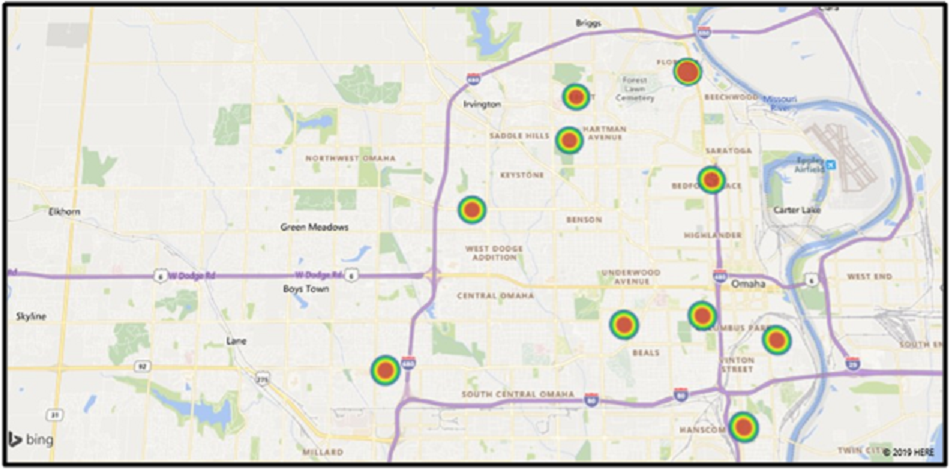
Figure 1: Distribution of the home visits within Omaha (classified by zip codes)
Families were recruited through two ongoing programs in Omaha: Asthma-In-Response (AIR) and Healthy Home programs. We recruited 21 families through the AIR program and 9 families through the Healthy Home program. Families in the AIR program have at least one child with asthma, and none of the homes recruited through the Healthy Home program had children with asthma. Through the AIR and Healthy Home programs, a comprehensive environmental assessment and air sampling of PM in homes was conducted to identify the possible environmental hazards that may affect children’s health and trigger asthma, like PM and mold.
Sampling method
At each location, we collected a 1-minute air sample using the 3016- IAQ particle counter (Medford, OR). This particle counter measures up to six particle sizes (0.3, 0.5, 1.0, 2.5, 5, 10 micrometers [μm]) from each location simultaneously and provides an approximate mass concentration for each particle size in micrograms per cubic meter (μg/m3). It also records temperature and relative humidity. The instrument was calibrated before each visit according to the manufacturer’s specifications. After each visit, we downloaded the data by attaching the particle counter to a computer with LMS Express software (Medford, OR).
Sampling locations
At each home, we took measurements in the living rooms and in the bedrooms because study participants indicated these were where children spent most of their time. We collected indoor air PM samples at two different heights, 2 feet and 4 feet, which approximate the breathing zones of toddlers and older children, respectively [36,37]. We obtained one sample from the kitchen because cooking is considered a source of indoor PM. Also, we took one sample from outside of the home for baseline. Therefore, we had six samples from each home.
Pre-sampling inspection and assessment
We evaluated the potential factors that may affect the levels of indoor PM. We hypothesized that the level of housekeeping, smoking inside homes, the presence of household pets, and the status of the furnace filters are the main factors that affect the levels of PM inside homes. Therefore, we asked study participants the following questions:
1. Does anyone smoke inside the home?
2. Are there any pets in the home?
3. How often do you vacuum the carpets in your home?
4. How often do you vacuum upholstered furniture and mattresses?
5. How often is the furnace filter changed?
We observed that some study participants use burning candles and some are cooking during our visit. Therefore, we evaluated the effect of using burning candles (when burned) and cooking activities on the levels of PM inside homes.
Data analysis
Statistical analyses of our collected data were performed by using IBM SPSS Statistics 25. Descriptive statistics, including the median and interquartile (IQ) range, Chi-Square tests, Mantel-Haenszel Common Odds Ratio Estimate, and nonparametric analogs (Mann-Whitney U test and Wilcoxon Signed Rank test) were used. First, we measured the proportion of homes with poor indoor air quality compared to outdoors. For each home, IAQ status was classified as poor or good. We defined the IAQ status as poor if 60% or more of indoor samples exceeded the outdoor levels. The basis of this definition is that we should have more than 50% of the indoor samples (at least 3 out of 6) exceeded the outdoor level to classify the IAQ as poor.
Secondly, we examined the association between the categorical explanatory variables and the first outcome (IAQ status). To examine this association, we performed Chi-Square tests, Pearson Chi-Square and Fisher's Exact Test, (if each cell had a minimum of five expected counts, we used Pearson Chi-Square p-value, if any of the expected cell counts was less than 5, we used Fisher's Exact Test p-value). We also performed Mantel-Haenszel Common Odds Ratio Estimate to examine this association. If p < 0.05 and 95 % CI of Odds Ratio (OR) did not include one, we concluded that there was a statistically significant association between the explanatory variable and IAQ status and that the explanatory variable affected the IAQ.
Third, we examined the association between the categorical explanatory variables (two levels each) and second the outcome (indoor PM median concentration). To examine the association, we performed a nonparametric Mann-Whitney U test to compare the median indoor PM concentration between the two groups of every single variable. If p < 0.05, we concluded that the indoor PM level was significantly different between the two groups of a single variable.
Lastly, we tested the difference between the two measured breathing zones (2 feet and 4 feet) median concentrations. To examine the difference, we performed a nonparametric Wilcoxon Signed Ranks test to compare the median PM concentration between the two groups. If p < 0.05, we concluded that the indoor PM level was significantly different between the two groups and that children’s exposure to PM varied significantly depending on their age and height.
IRB determination
This study was exempted by the UNMC Institutional Review Board.
Results And Discussion
Household characteristics
Table 1 summarizes the characteristics of the homes that we visited. Seventy percent of the homes (n = 21) had at least one child diagnosed with asthma. According to our definition of IAQ status, 56.7% of the visited homes (n = 17) had poor IAQ.
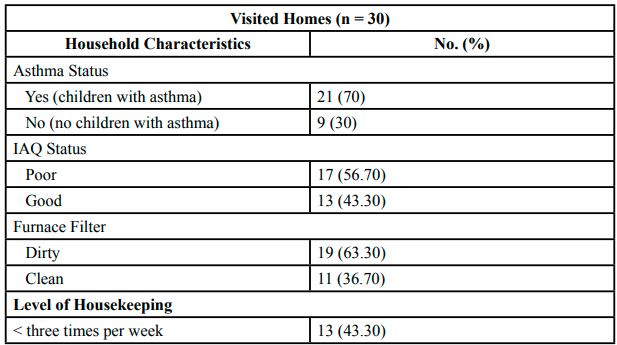
Table 1:Characteristics of the visited homes (n = 30)
For each home visit, we checked the furnace filter to find out if it is dirty or clean. We classified the furnace filter as dirty if it is heavily loaded with dirt. We also asked families about the frequency of the filter’s replacement. In 63.3% of the visited homes (n = 19), we found that the furnace filter was dirty, while 36.7% (n = 11) had a clean furnace filter. In terms of the level of housekeeping, our results showed that 43.3% of the families (n = 13) clean and vacuum their homes (all surfaces including carpet and wood) less than three times per week, and 56.7% of the families (n = 17) stated that their homes are cleaned and vacuumed more than three times per week. We found that 36.7% of the visited families (n = 11) had household pets (dogs or cats). Only ten percent of the visited families (n = 3) declared that they smoke inside their homes, and 90% (n = 27) reported that they never smoke inside their homes.
Indoor and outdoor PM levels
Indoor PM levels ranged from 4.28 to 72.81 μg/m3, with a median of 13.91 μg/m3(IQ range [8.99, 25.43]). Outdoor PM levels ranged from 3.32 to 47.95 μg/m3, with a median of 8.95 μg/m3(IQ range [5.08, 17.02]). Our results showed that indoor PM levels were higher than the outdoor levels. Generally, it is difficult to make direct comparisons of indoor PM concentrations with other studies because of differences in collection methods and sampling strategies. However, our results were consistent with McCormack et al [8], who found that indoor PM concentrations in children’s homes were higher than outdoor concentrations. Also, in North America, a review of 28 major studies measuring outdoor and indoor PM levels inside homes revealed that in 17 of these studies, indoor levels can be up to 3.5 times greater than outdoor levels [9]. Many indoor sources and activities inside homes such as cooking, walking on carpets, pets, and cleaning chemicals can play a significant role in increasing the indoor levels of PM.
Furthermore, outdoor air is considered a significant source of PM in the indoor environment. Outdoor sources of PM are mainly motor vehicle emissions; thus, the home’s proximity to a main road or a street might increase indoor PM levels. Usro et al [38] found that indoor particulates can also be from an outdoor source depending on the home ventilation and air exchange rates, which can significantly affect indoor PM concentrations. Air exchange rates are affected by outdoor–indoor temperature differences; therefore, they can substantially affect indoor PM levels, especially when the outdoor levels are high [33]. Our findings indicate that children are exposed to PM inside homes at higher concentrations compared to outdoor. Therefore, indoor sources of PM should be properly controlled and maintained to minimize children’s exposure.
Temperature and relative humidity
Indoor temperature levels ranged from 59.8o F to 83.4oF with a median of 72.85oF, and relative humidity ranged from 21.9% to 65.5% with a median of 38.25%. Our results showed variations in temperature and relative humidity levels inside homes, which were because of the sampling period of our study (between October 2018 and September 2019), which included Winter, Spring, and Summer seasons. The American Society of Heating, Refrigeration, and Air-Conditioning Engineer’s (ASHRAE) recommends that indoor temperature ranges from 68.5oF to 75oF during the winter, and from 75o F to 80.5oF during the summer. The indoor relative humidity level recommended by ASHRAE is 65% or below [39].
Particulate matter levels at the two measured heights (breathing zones)
Table 2 demonstrates the levels of PM at the two measured heights. We collected PM samples from the living rooms and the bedrooms at levels of 2 feet and 4 feet. In the living rooms, the median PM concentration at two feet was 18.05 μg/m3(IQ range [10.93, 26.15]), and the median PM concentration at four feet was 13.13 μg/m3(IQ range [8.05, 22.38]). There was a statistically significant difference between the indoor PM levels at these two heights in the living rooms (p < 0.05). The median PM concentration at two feet in the bedrooms was 14.18 μg/m3(IQ range [7.51, 22.43]), and the median PM concentration at four feet was 11.32 μg/m3(IQ range [5.05, 17.79]). Also, there was a statistically significant difference between indoor PM levels at these two heights in the bedrooms (p < 0.05).
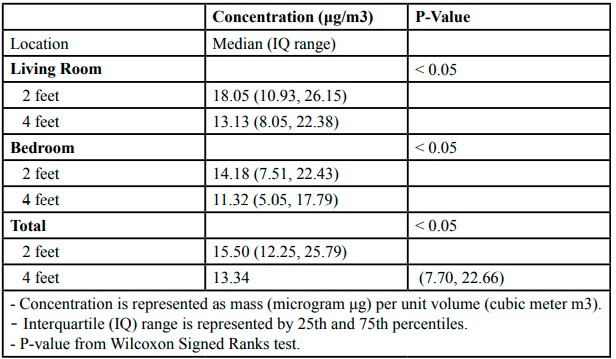
Table 2:Particulate matter levels at 2 feet and 4 feet
These results indicate that younger children at heights closer to the resuspension surfaces (i.e., surfaces that can collect PM and get airborne again) are exposed to higher levels of resuspended PM compared to older children. The differences in PM concentrations between the two breathing zones could be due to the occupants’ movement and activities that will result in resuspension of settled PM. Exposure to PM inside homes can be affected by resuspension of PM that is caused by regular occupants’ activities (e.g., walking on carpets).
Studies have shown that normal human activities inside homes such as walking on carpets and sitting on upholstered furniture can re-suspend the smaller sizes of PM [20,21]. Ferro [20] found that walking activities inside homes can cause resuspension of settled PM, which will generate more mass of PM2.5, PM5, and PM greater than 5 μm. These activities will increase PM levels in the breathing zones of younger children.
Comparisons of indoor air quality status and household characteristics
IAQ and the furnace filter status: We found that 82.4% of homes with poor IAQ (14 homes, n = 17) had a dirty furnace filter, and 61.5% of homes that were defined with good IAQ (8 homes, n = 13) had a clean filter. As shown in Table 3, there was a statistically significant association between IAQ status and the furnace filter status (p = 0.023). The odds of having poor IAQ for homes with dirty furnace filter was about 7.5 times more than homes with clean furnace filter (OR = 7.47, 95% CI: 1.40, 39.84). Considering the aforementioned, IAQ status inside homes could vary significantly depending on the furnace filter status and the frequency of its replacement.
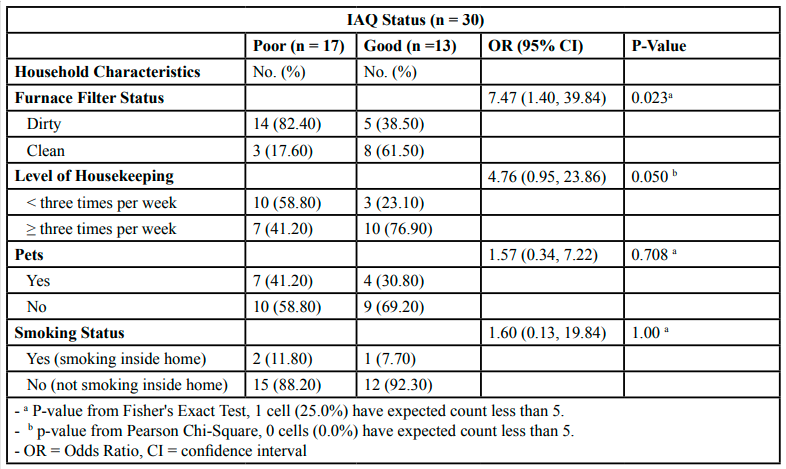
Table 3:Association between IAQ status and household characteristics (n = 30)
Furnace filters are placed in HVAC systems to allow proper air filtration throughout the home. Air filtration is considered an efficient technique to eliminate the sources of indoor air pollutants and improve IAQ [40]. To improve air quality inside homes, ASHRAE recommends the use of filters with a Minimum Efficiency Reporting Value (MERV) 11 rating and above that provide 65% to 85% particle removal efficiency [41]. During our visits, we encountered some issues that may decrease the filtration efficiency of HVAC system, such as improper installation of a filter or installing a filter with wrong size. Therefore, attention should be paid to proper maintenance and regular replacement of these filters in order to improve IAQ.
IAQ status and the level of housekeeping:
As shown in Table 3, in 58.8% of homes with poor IAQ (10 homes, n = 17), the cleaning and vacuuming of carpets were conducted less than three times per week. About 77% of homes that were defined with good IAQ (10 homes, n = 13) cleaned and vacuumed their carpets more than three times per week. We found that the air quality status inside homes suggests a significant association with the level of cleaning (p = 0.050). The odds of having poor IAQ for families who cleaned their homes less than three times per week was about 4.8 times more than families who cleaned their homes more than three times per week (OR = 4.76, 95% CI: 0.95, 23.86).
Our results suggest that IAQ status inside homes could vary significantly depending on the level of housekeeping. A clean home is a healthier home because regular cleaning activities can prevent the accumulation of dust particles and pet dander inside homes. In addition, using a vacuum machine equipped with a High Efficiency Particulate Air (HEPA) filter to clean the carpets and upholstered furniture can reduce resuspension of settled PM and will reduce its levels. Cleaning efforts and practices will have a substantial impact on IAQ.
Our data showed that there was no significant association between IAQ status and household pets (p = 0.708) and smoking inside homes (p = 1.00) with odds ratios of 1.57 and 1.60, respectively. Only three clients, who have children with asthma, reported that they smoke inside their homes. Therefore, we were not able to associate smoking inside homes with IAQ status.
Comparisons of indoor particulate matter levels and household characteristics
Indoor PM levels and IAQ status: Table 4 demonstrates the association between indoor PM levels and IAQ status. The median indoor PM concentration in homes with poor IAQ status (n = 17) was 18.53 μg/m3(IQ range [13.39, 33.57]), and the median indoor PM concentration in homes which were defined with good IAQ (n = 13) was 9.53 μg/m3 (IQ range [6.99, 15.56]). There was a statistically significant difference between indoor PM levels for homes with poor IAQ and homes with good IAQ (p = 0.007).
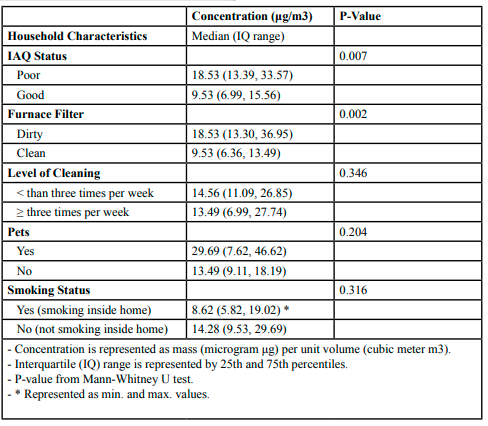
Table 4:Association between indoor PM levels and household characteristics (n = 30)
Indoor PM levels and the furnace filter status:
Table 4 also shows the association between indoor PM levels and the furnace filter status. The median indoor PM concentration in homes with dirty furnace filters (n = 19) was 18.53 μg/m3(IQ range [13.30, 36.95]), and the median indoor PM concentration in homes in which furnace filters were cleaned and replaced regularly (n = 11) was 9.53 μg/m3 (IQ range [6.36, 13.49]). We can conclude from Table 4 that indoor PM levels differed significantly depending on the furnace filter status and the frequency of its replacement (p = 0.002).
Our results denote that air quality inside homes and furnace filter status had a significant influence on children’s exposure to indoor PM. These results are not surprising since furnace filters are mainly designed to filter particles inside homes. Sublett [41] showed that several types of furnace filters, such as MERV 11–13 filters are effective for PM reduction. Furnace filters can quickly get dirty depending on many indoor factors and will not allow proper air filtration throughout the home. Sublett [41] stated that dirty furnace filters and poorly maintained HVAC systems could be significant sources of indoor air pollutants, especially fungal spores and PM. Thus, it is recommended by EPA to replace the filters every two to three months or according to the manufacturer’s recommendations.
Moreover, we noticed during our visits that some families, particularly with asthmatic children, utilize additional air filters (e.g., portable room air cleaners (PRACs) or stand-alone filters) to improve air quality inside their homes. Homes that use these filters showed a significant reduction in PM levels. Batterman et al [33] found that PM levels inside homes can be reduced by 50% with the use of stand-alone filters. Also, Du et al [42] stated that stand-alone filters reduced PM levels in asthmatic children’s homes by 69 to 80%.
On the contrary, PM levels inside homes did not vary significantly in terms of the level of housekeeping (p = 0.346), the household pets (p = 0.204), and smoking inside homes (p = 0.316). Nevertheless, our results demonstrated that indoor PM levels were higher in homes that were cleaned and vacuumed less than three times per week (median = 14.56 μg/m3, n = 13) compared to homes in which cleaning and vacuuming was conducted more than three times week (median = 13.49 μg/m3, n = 17). Also, the levels of PM inside homes with household pets (n = 11) were greater than homes with no household pets (n = 19), with median concentrations of 29.69 μg/m3and 13.49 μg/m3,/sup>, respectively.
These results were not in agreement with McNamara et al [43], who found that there is a significant association between PM levels, particularly PM2.5 and PM10, inside homes and the presence of household pets. In terms of smoking inside homes, studies have shown that smoking inside homes is significantly associated with fine PM levels [44,45]. Semple et al [44] stated that fine PM concentrations inside smokers’ homes are ten times greater than non-smokers’ homes. Also, Holm et al [45] found that there is a significant association between the mean monthly indoor PM2.5 level and the presence of a smoker inside the home. However, our study could not build a rigorous association (neither positive nor negative) between indoor PM levels and smoking inside homes because only three homes (out of 30) reported that they smoke inside.
We found that other indoor sources which were noticed in some homes, especially the burning of candles, significantly increased indoor PM levels. We observed that the levels of indoor PM were higher in homes in which the candles were burned during our visit. Burning candles release volatile organic compounds (VOCs) and polycyclic aromatic hydrocarbons (which are carcinogenic) in the air which increase the levels of PM [46]. It has been found that the use of burning candles is associated with high levels of indoor PM. Manoukian et al [47] found that PM levels in indoor air increased rapidly during the burning of candles. Moreover, airborne cooking residuals are considered significant sources of PM inside homes. Holm et al [45] showed that the median PM levels were greater during cooking times compared to non-cooking times.
Recommendations
Based on our findings, we recommend the following steps that occupants can take to reduce exposure to PM inside homes:
Replace furnace filter on a regular basis (at least every three months or as recommended by the manufacturer).
Ensure proper air circulation by not blocking return and supply vents
Dust and vacuum regularly (at least three times a week).
Strengths and limitations
A strength of this study was that we identified the main indoor environmental factors and sources that were useful for estimating PM levels and air quality inside homes. To our knowledge, no study in Omaha has assessed air quality in low SES homes. However, the cross-sectional nature of this study is a key limitation. We assume that PM levels may vary depending on how indoor environmental factors and sources are controlled.
Conclusion
This study demonstrated that IAQ and indoor PM levels were significantly associated with the furnace filter status (dirty or clean). We also suggest that the level of housekeeping was associated with IAQ status, but not with indoor PM levels. On the other hand, IAQ and indoor PM levels were not significantly related to the presence of household pets and smoking inside homes. Moreover, our study showed that there was a statistically significant difference between PM levels at 2 feet and 4 feet and that exposure to indoor PM varied significantly depending on the child’s height.
Conflict of interests:
The author declares no conflict of interest.
Acknowledgments:
This study was funded through grants from the Environmental Protection Agency and the University of Nebraska Medical Center College of Public Health. The authors thank Ms. Shannon Melton, Mr. Dupree Claxton, Ms. Kat Vinton, Mr. Benny Huerta, Mr. Ian Sheets, and Ms. Shelby Larson from Omaha Healthy Kids Alliance for assisting with field data collection, and Ms. Rachel Maley for assistance with manuscript preparation.
References
U.S. Environmental Protection Agency. (2018). Introduction to indoor air quality. Indoor Air Quality Web site. https://www. epa.gov/indoor-air-quality-iaq/introduction-indoor-air-quality. Accessed November 25.View
U.S. Environmental Protection Agency. Indoor air quality. ( 2019). Report on the Environment Web site. https://www.epa. gov/report-environment/indoor-air-quality#note2.Updated 2018. Accessed October 11.View
Hulin, M., Simoni, M., Viegi, G., & Annesi-Maesano, I. (2012). Respiratory health and indoor air pollutants based on quantitative exposure assessments. Eur Respir J;40(4):1033-1045.View
Annesi-Maesano I, Baiz N, Banerjee S, Rudnai P, & Rive S, (2013). SINPHONIE Group. Indoor air quality and sources in schools and related health effects. J Toxicol Environ Health, Pt B. ;16(8):491-550.View
Anderson, J.O., Thundiyil, J.G., & Stolbach, A. (2012). Clearing the air: A review of the effects of particulate matter air pollution on human health. Journal of Medical Toxicology;8(2):166-175.View
Custódio, D., Pinho, I., Cerqueira, M., Nunes, T., & Pio, C. (2014). Indoor and outdoor suspended particulate matter and associated carbonaceous species at residential homes in northwestern Portugal. Sci Total Environ; 473:72-76.View
Nasir, Z.A., & Colbeck, I. (2013). Particulate pollution in different housing types in a UK suburban location. Sci Total Environ;445:165-176.View
McCormack, M.C., Breysse, P.N., & Hansel, N.N., et al. (2008). Common household activities are associated with elevated particulate matter concentrations in bedrooms of inner-city Baltimore pre-school children. Environ Res;106(2):148-155.View
Chen, C., & Zhao, B. (2011). Review of relationship between indoor and outdoor particles: I/O ratio, infiltration factor and penetration factor. Atmos Environ;45(2):275-288.View
Kim, K., Kabir, E., & Kabir, S. (2015). A review on the human health impact of airborne particulate matter. Environ Int;74:136- 143.View
Halonen, J.I., Lanki, T., Yli-Tuomi, T., Tiittanen, P., Kulmala, M., & Pekkanen, J. (2009). Particulate air pollution and acute cardiorespiratory hospital admissions and mortality among the elderly. Epidemiology;143-153.View
Guaita, R., Pichiule, M., Maté, T., Linares, C., & Díaz, J. (2011). Short-term impact of particulate matter (PM2. 5) on respiratory mortality in Madrid. Int J Environ Health Res;21(4):260-274.View
Lelieveld, J., Evans, J.S., Fnais, M., Giannadaki, D., & Pozzer, A. (2015). The contribution of outdoor air pollution sources to premature mortality on a global scale. Nature;525(7569):367.View
Liu, C., Chen, R., & Sera, F., et al. (2019). Ambient particulate air pollution and daily mortality in 652 cities. N Engl J Med;381(8):705-715.View
WHO (2005). WHO Air quality guidelines for particulate matter, ozone, nitrogen dioxide and sulfur dioxide.View
Salvi, S. (2007). Health effects of ambient air pollution in children. Paediatric Respiratory Reviews;8(4):275-280.View
Bennett, W.D., Zeman, K.L., & Jarabek, A.M. (2007). Nasal contribution to breathing and fine particle deposition in children versus adults. Journal of Toxicology and Environmental Health, Part A;71(3):227-237.View
Foos, B., Marty, M., & Schwartz, J., et al. (2007). Focusing on children's inhalation dosimetry and health effects for risk assessment: An introduction. Journal of Toxicology and Environmental Health, Part A.;71(3):149-165.View
Franck U, Herbarth O, & Röder S, et al. (2011). Respiratory effects of indoor particles in young children are size dependent. Sci Total Environ;409(9):1621-1631.View
Ferro, A.R., Kopperud, R.J., & Hildemann, L.M. (2004). Source strengths for indoor human activities that resuspend particulate matter. Environ Sci Technol;38(6):1759-1764.View
Rosati, J.A., Thornburg, J., & Rodes, C. (2008). Resuspension of particulate matter from carpet due to human activity. Aerosol Science and Technology;42(6):472-482.View
Keet, C.A., Keller, J.P., & Peng, R.D. (2018). Long-term coarse particulate matter exposure is associated with asthma among children in Medicaid. American Journal of Respiratory and Critical Care Medicine;197(6):737-746.View
Bowatte, G., Lodge, C., & Lowe, A.J., et al. (2015). The influence of childhood traffic�related air pollution exposure on asthma, allergy and sensitization: A systematic review and a meta�analysis of birth cohort studies. Allergy;70(3):245-256.View
Jedrychowski, W.A., Perera, F.P., & Spengler, J.D., et al. (2013). Intrauterine exposure to fine particulate matter as a risk factor for increased susceptibility to acute broncho-pulmonary infections in early childhood. Int J Hyg Environ Health;216(4):395-401.View
MacIntyre, E.A., Gehring, U., & Molter, A., et al. (2014). Air pollution and respiratory infections during early childhood: An analysis of 10 European birth cohorts within the ESCAPE project. Environ Health Perspect;122(1):107-113.View
Liu, H., Dunea, D., Iordache, S., & Pohoata, A. (2018). A review of airborne particulate matter effects on young children’s respiratory symptoms and diseases. Atmosphere;9(4):150.View
Jedrychowski, W.A., Perera, F.P., & Maugeri, U., et al. (2010). Effect of prenatal exposure to fine particulate matter on ventilatory lung function of preschool children of non�smoking mothers. Paediatr Perinat Epidemiol;24(5):492-501.View
Gehring, U., Gruzieva, O., & Agius, R.M., et al. (2013). Air pollution exposure and lung function in children: The ESCAPE project. Environ Health Perspect;121(11-12):1357-1364.View
Chen, C., Chan, C., Chen, B., Cheng, T., & Guo, Y.L. (2015). Effects of particulate air pollution and ozone on lung function in non-asthmatic children. Environ Res;137:40-48.
Jung, K.H., Hsu, S., & Yan, B., et al. (2012). Childhood exposure to fine particulate matter and black carbon and the development of new wheeze between ages 5 and 7 in an urban prospective cohort. Environ Int;45:44-50.View
Lee, J.H., Lee, H.S., & Park, M.R., et al. (2014). Relationship between indoor air pollutant levels and residential environment in children with atopic dermatitis. Allergy, Asthma & Immunology Research;6(6):517-524.View
Bhangar, S., Mullen, N., Hering, S., Kreisberg, N., & Nazaroff, W. (2011). Ultrafine particle concentrations and exposures in seven residences in northern California. Indoor Air;21(2):132- 144.View
Batterman, S., Du, L., & Mentz, G., et al. (2012). Particulate matter concentrations in residences: An intervention study evaluating stand-alone filters and air conditioners. Indoor Air;22(3):235-252.View
Clements, N., Keady, P., Emerson, J., Fierer, N., & Miller, S. (2018). Seasonal variability of airborne particulate matter and bacterial concentrations in Colorado homes. Atmosphere;9(4):133.View
U.S. Department of Housing and Urban Development. (2019). income limits summary. (2019). Income Limits Documentation System Web site. https://www.huduser.gov/portal/datasets/il/ il2019/2019summary.odn. Updated 2019. Accessed October 29.
Centers for Disease Control and Prevention. Data table of stature-for-age charts. (2019). National Center for Health Statistics Web site. https://www.cdc.gov/growthcharts/html_ charts/statage.htm#males. Updated 2001. Accessed October 29.View
Knoppert, D., Reed, M., & Benavides, S., et al. (2007). Paediatric age categories to be used in differentiating between listing on a model essential medicines list for children. Word Health Organization Position Paper;1(5).
Urso, P., Cattaneo, A., Garramone, G., Peruzzo, C., Cavallo, D.M., & Carrer, P. (2015). Identification of particulate matter determinants in residential homes. Build Environ;86:61-69.View
Centers for Disease Control and Prevention. Indoor environmental quality. (2019). Workplace Safety & Health Topics Web site. https://www.cdc.gov/niosh/topics/indoorenv/ temperature.html. Updated 2015. Accessed October 13.View
Vijayan, V.K., Paramesh, H., Salvi, S.S., & Dalal, A.A. (2015). Enhancing indoor air quality -the air filter advantage. Lung India;32(5):473-479.View
Sublett, J.L. (2011). Effectiveness of air filters and air cleaners in allergic respiratory diseases: A review of the recent literature. Current Allergy and Asthma Reports;11(5):395.View
Du, L., Batterman, S., & Parker, E., et al. (2011). Particle concentrations and effectiveness of free-standing air filters in bedrooms of children with asthma in Detroit, Michigan. Build Environ;46(11):2303-2313.View
McNamara, M., Thornburg, J., Semmens, E., Ward, T., & Noonan, C. (2013). Coarse particulate matter and airborne endotoxin within wood stove homes. Indoor Air;23(6):498-505.View
Semple, S., Apsley, A., Azmina Ibrahim, T., Turner, S.W., & Cherrie, J.W. (2015). Fine particulate matter concentrations in smoking households: Just how much secondhand smoke do you breathe in if you live with a smoker who smokes indoors? Tob Control;24(e3):e205-11.View
Holm, S.M., Balmes, J., & Gillette, D., et al. (2018). Cooking behaviors are related to household particulate matter exposure in children with asthma in the urban East Bay Area of Northern California. PloS One;13(6):e0197199.View
Derudi, M., Gelosa, S., & Sliepcevich, A., et al. (2014). Emission of air pollutants from burning candles with different composition in indoor environments. Environmental Science and Pollution Research;21(6):4320-4330.View
Manoukian, A., Quivet, E., Temime-Roussel, B., Nicolas, M., Maupetit, F., & Wortham, H. (2013). Emission characteristics of air pollutants from incense and candle burning in indoor atmospheres. Environmental Science and Pollution Research; 20(7):4659-4670.View