
- About the Journal
- Editorial Board
- Review Process
- Author Guidelines
- Article Processing Charges
- Special Issues
- Indexing
- Current Issue
- Past Issue
 Journal of Public Health Issues and Practices
Journal of Public Health Issues and Practices Volume 7 (2023), Article ID: JPHIP-218
https://doi.org/10.33790/jphip1100218Research Article
Impact of Body Mass Index (BMI) and Perceived Weight on Academic Performance in African American Students In an Urban Public School System
Elgin Andrews, Joshua Wludyga, and Karla Caillouet
Georgia Gwinnett College, 1000 University Center Ln, Lawrenceville, GA 30043, United States.
*Corresponding Author Details: Elgin B. Andrews, PhD, Assistant Professor of Exercise Science, Georgia Gwinnett College, 1000 University Center Ln, Lawrenceville, GA 30043, United States.
Received date: 29th May, 2023
Accepted date: 20th July, 2023
Published date: 22nd July, 2023
Citation: Andrews, E., Wludyga, J., & Caillouet, K., (2022). Impact of Body Mass Index (BMI) and Perceived Weight on Academic Performance in African American Students In an Urban Public School System. J Pub Health Issue Pract 7(2): 218.
Copyright: ©2023, This is an open-access article distributed under the terms of the Creative Commons Attribution License 4.0, which permits unrestricted use, distribution, and reproduction in any medium, provided the original author and source are credited.Creative Commons Attribution License, which permits unrestricted use, distribution, and reproduction in any medium, provided the original author and source are credited
Abstract
The purpose of this study was to determine the relationship between BMI, perceived weight and academic performance in African American students (N=78) attending a majority-minority school. Assessments were performed during a summer academic enrichment program. Perceived weight determined from responses to a data collection questionnaire. Height and weight were measured to determine BMI. Standardized test scores and grade point averages were collected from students’ respective schools. Perceived weight and actual BMI were positively correlated (rpb= .72; p < .01). There was a positive relationship between perceived weight and reading (rpb= .345, p < .05) and English/language arts (ELA rpb= .323, p <.05) for female participants. Results indicated no relationship between BMI, perceived weight and academic performance. As perception of weight increased, reading and ELA standardized test scores increased for female participants. Further research is warranted to ascertain whether perceived weight is a protective factor for African-American females.
Key Words: Obesity, African American, Academic Performance, BMI, Perception of Weight
Introduction
Obesity, whether actual or perceived, can have a negative mental, social, and academic effect on youth [1-3]. This effect is especially prevalent during adolescence where studies show that negative self-perception of weight is associated with aberrant and suicidal behavior, depression, and low self-esteem [4-6]. This negative self perception of weight is exacerbated by pressure from their healthy weight peers, whom studies suggest perform better academically [2]. Focusing on the relationship between perceived weight and academic performance, studies show that a negative association exists between the two variables [2]. Some studies have attributed the negative relationship between obesity and academic performance to the teacher or to weight-based teasing from peers [7].
Obesity (or the perception of being obese) can affect an adolescent both physically and psychologically. Adolescent health outcomes related to obesity, such as asthma [8] and Type 2 diabetes [9], can cause students to miss school [10] and therefore play an indirect role in academic performance. Obese students experience psychological issues that can negatively affect their self-esteem [11], body satisfaction [12], and consequently their academic performance.
The issue of perception of weight is more complicated for minorities. Research reveals that African-Americans are more likely to have a misperception of their weight. More specifically, African Americans were more likely to underestimate their weight [13]. The underestimation of weight is even more significant in African American females, who have the highest prevalence of obesity [14]. One study reported an association between obesity and weight dissatisfaction in both genders, but in females an association was found to coincide with poor school performance [15].
Cultural attitudes and environmental factors lay the foundation for obesity tolerance in the African-American community. This tolerance coupled with the disproportionate percentage of obesity has created an “obesogenic” culture. This culture is accepted as the “norm”, further perpetuating the cycle of obesity. The underestimation of weight coupled with these attitudes and factors further complicate the challenges in curbing the obesity epidemic disproportionately affecting the African-American community.
Studies investigating the relationship between obesity and academic performance are often limited to the assessment of African-Americans who attend schools in predominantly Caucasian school systems [16-17]. The study of obesity, perceived weight, and academic performance of African-American students has not been researched in predominately African-American schools, where racial and cultural norms are different. The relationship between obesity, perceived weight, and academic performance in African-American communities is especially relevant because of the disproportionate prevalence of obesity and the gap in academic performance when compared to their white peers [18-20].
Methods
Participants
The purposive sampling method was applied to select study participants. One hundred fifty middle school students (aged 10-14 years) were given the option to participate in the study upon enrollment into a summer academic enrichment program. Seventy-two students were excluded from the final analysis as a result of incomplete data (e.g., such as missing standardized test scores and/or grades). All subjects self-identified as African-American and qualified, under federal guidelines, for free or reduced-price lunch program (used as a marker for low socioeconomic status). The sample included 45 (57%) females and 33 (41.8%) males. The urban school system consists of approximately 75.5% African-American students, 14.7% Caucasian, 6.8% Hispanic, 1.6% multiracial, and 1.2% Asian, American Indian, Alaskan, and other [21].
Instrumentation
All data measurements were performed on site at the respective schools, and all subject data forms were number coded and contained no personal identifying information. Data files were stored on a password-protected computer accessible only to designated study personnel. All assessments took place in secured and private locations at the respective academic enrichment summer program site.
Height was measured using a stadiometer and reported in centimeters. Weight was measured using a calibrated electronic beam scale with a digital readout to the nearest 0.1 kilogram (kg). Subjects were asked to remove their shoes prior to any measurement. Body Mass Index, or BMI (Weightkg/Heightm2) was used as a proxy measure of obesity. Participants were classified according to BMI-for-age percentiles. Using BMI percentiles, subjects were categorized as underweight if their BMI was less than the 5th percentile, normal weight if between the 5th and 84th percentile, overweight if greater than or equal to the 85th percentile and less than the 95th percentile, or obese if greater than or equal to the 95th percentile [22-23]. Weight perception was determined from responses to a data collection questionnaire (Figure 1) administered by the researcher. Participants chose between the following options: underweight, normal weight, overweight, or very overweight. Academic performance and cumulative grade point average (GPA) data were provided to researchers by the respective school site liaisons. Academic performance consisted of Georgia Criterion Referenced Competency Test (CRCT) standardized scores in reading, English/language arts (ELA), and mathematics. For each grade level, CRCT scores: less than 800 are classified as “does not meet academic expectations”; between 800 and 849 “meets academic expectations”; and greater than 850 “exceeds academic expectations”. The mean standardized test scores for reading 834.3 ± 19.9, ELA 836.1 ± 19.9, and math 825.5 ± 19.9 were in the “meets expectations” classification, with only one subject in ELA and five subjects in math “not meeting expectations”. Cumulative GPA was used as a subjective measure of academic performance because some studies show teacher bias can influence grades [17,25].
Data Analysis
All statistical analyses were performed using the Statistical Package for Social Sciences (SPSS, Inc., Chicago, IL). Descriptive statistics means and standard deviations were computed for the measured variables. Pearson point biserial correlation coefficients (rpb) were calculated to analyze the strength of association among BMI, BMI percentiles, perception of weight, standardized test scores, and GPA. An independent samples T-test was conducted to compare the difference between the means of reading, ELA, and math for the weight perception groups.
Results
The mean age of the participants was 12.53 ± 1.1 years, height 160.0 ± 9.0 cm, body weight 60.7 ± 19.1 kg, BMI 23.4 ± 6.0, and BMI percentile 76.8 ± 23.0. Forty (51.3%) subjects were categorized into a group with a BMI > 85th percentile and thirty-eight (48.7%) had a BMI < 84th percentile. Analysis by gender indicated that relative mean BMI percentiles were higher for females (79.6 ± 19.5) than for males (72.8 ± 26.6), with both means classified as overweight in the 92nd and 93rd percentile respectively [26].
Objective academic performance is represented by CRCT standardized test scores in reading, ELA, and math. Subjective academic performance is represented by GPA. The mean GPA, 82.5 ± 5.8, is classified as a “B” average. The mean standardized test scores (reading 834.3 ± 19.9, ELA 836.1 ± 19.3, and math 825.5 ± 21.4) were in the “meets academic expectations” classification.
BMI was positively correlated with perception of weight (rpb= .72; p < .01) indicating that as BMI increased so did the participants perception of their weight. The analysis by gender revealed similar results for both females (rpb= .71; p < .01) and males (rpb= .74; p < .01). (Table 1). No significant relationship between BMI and academic performance was found for GPA or CRCT scores in reading, ELA, and math for the sample. An analysis by gender did not reveal any significant relationship between BMI and academic performance (Table 2)(Table 3).
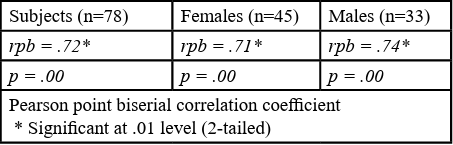
Table 1. Relationship Between BMI and Weight Perception of Subjects in Total Group and by Gender (N=78)

Table 2. Relationship Between BMI and CRCT Standardized Test Scores and GPA of Subjects (N=78)
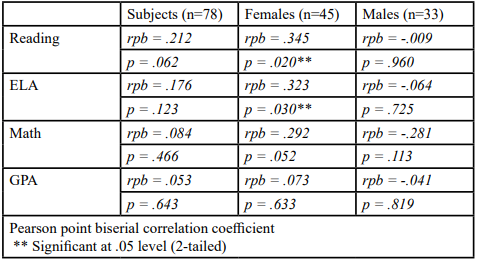
Table 3. Relationship Between Perceived Weight and CRCT Standardized Test Scores and GPA of Subjects (N=78)
BMI was interpreted using BMI-for-age growth charts to obtain each subject’s percentile ranking. Percentiles are the most commonly used because they compare BMI to adolescents of the same age and gender. Pearson point biserial correlation analysis indicated no significant relationship between BMI percentiles and academic performance for GPA and CRCT scores in reading, ELA, and math. Analysis by gender also did not reveal any significant correlations. Pearson point biserial correlation indicated no significant relationship between BMI Z-score and academic performance. A further analysis by gender also revealed no significant associations. Analysis by Pearson point biserial correlation indicated no association between perceived weight and academic performance. However, Pearson point biserial correlation by gender found a significant positive relationship between perceived weight and CRCT scores for females in reading (rpb= .345, p < 0.05) and ELA (rpb = .323, p <0 .05).
Discussion
Obesity is a known public health issue particularly relevant to minority youth; however, research has not been conducted on whether perceived weight or actual weight has a stronger association with academic performance in African American adolescents. The purpose of this study was to determine the relationship between BMI, perceived weight, and academic performance in African American students (N=78) attending a majority-minority school. This study is unique because it examines the difference between perception and reality using authentic assessments, a questionnaire, and objective (standardized tests) and subjective (grade point average) forms of academic performance.
Calculated BMI and BMI-for were used as proxy measures for obesity. Academic performance was defined by using standardized test (CRCT) scores for reading, ELA, and mathematics, and GPA. CRCT is a standardized test used as an objective measure of academic performance. It is arguable that GPA is a more subjective measure of academic performance because certain studies have demonstrated teacher biases may adversely affect the GPA of obese students [1,27]. Therefore, GPA is used in this study only as a subjective measure of academic performance.
Demographics of summer program reflect the racial makeup of the schools that students attended. All subjects identified themselves as African American and qualified under federal guidelines for the free or reduced-price lunch program, which served as a proxy measure for low socioeconomic status (SES). Both females (rpb = .71, p < .01) and males (rpb = .74, p < .01) measured BMI were highly correlated with their perceived weight. Even though specific gender differences were noted in obesity measures, none were found to have a relationship with BMI and academic performance.
The results of this investigation indicating no relationship between BMI and academic performance is not surprising given that prior research showed conflicting results [28]. This study can provide a framework for other studies since it is one of the first studies sampling African American youth attending predominately minority middle schools.
Interestingly, research that demonstrated a relationship between perceived weight and academic performance indicated a negative association [2]. This study revealed a positive relationship between perceived weight and standardized test scores for female students, but no relationship was found between perceived weight and GPA for either gender. In studies [17,27] where a relationship was found between perceived weight and GPA, it was attributed to the teacher’s prejudice toward overweight and obese students. However, unlike this current study, those studies did not review minority students in a predominately African American school environment. Therefore, the different results in this current study may be due to the cultural attitude toward obesity and the high prevalence of overweight and obese students in predominately African American schools. In this environment, teacher bias may not negatively affect student’s grades compared to schools where African American students are the minority.
There are many questions regarding the perception of weight and gender as it affects academic performance among African American youth, especially females. Consistent with research, male adolescents are not as affected by perceptions of weight as females [6,29-31]. However, both genders show a positive correlation between measured BMI and the perception of body weight, which runs contrary to some studies that show African-Americans often underestimate their weight [13,32]. None of the analyses of this study indicate that males are affected by their perception of weight for subjective or objective forms of academic performance. The same is not true for females as the self-perception of their weight positively correlates to how they perform on standardized tests. This is both interesting fascinating and contradictory in that their test scores increased as the perception of their weight increased. These findings, along with the lack of research regarding minorities in their respective communities and the effect of perceived weight on academic performance, warrant additional research.
Conclusion
This study explored the relationship between BMI, perceived weight, and academic performance in African American students in a school system where they are the majority. BMI was not found to be significantly associated with academic performance, defined by CRCT standardized test scores in reading, ELA, and math or GPA. In addition, no significant relationship was found between perceived weight and academic performance for the total sample. However, a positive relationship was found between perceived weight and reading, ELA and math in female subjects. This relationship was not observed in male subjects. Research indicates that African American adolescent females are disproportionately negatively affected by actual [6] and perceived weight [4]. Research also reveals a significant underestimation of weight among African-Americans females [13]. However, this study found that in majority African American schools, African-American females did not underestimate their weight and their weight perception did not negatively affect academic performance as in majority non-Hispanic white schools. One study reported that African American teens in white areas do not benefit from social cohesion and social support necessary to deal with “out-group” stress [13]. This social cohesion or acceptance of larger body frames is more acceptable in African American communities and schools. This acceptance in the African American community can explain the positive correlation among females of their weight perception and standardized test subject areas.
Limitations
One limitation of this study was the sample consisted only of students participating in the summer academic enrichment program. Participants in this program have greater school attendance, higher grade point average, and better standardized test scores than their peers who do not attend. Another limitation was the small sample size. Although one hundred fifty students agreed to participate in the study, only seventy-eight were included. The collection of data at different times was another limitation. Particularly, BMI and the weight perception questionnaire data were collected during the summer while cumulative GPA was collected during the academic school year.
Implications For Health Behavior or Policy
More research must be conducted in schools that have a majority minority student population, because these populations historically have disproportionate incidences of obesity, obesity related negative health outcomes, and negative academic indicators (actual and perceived). Programs within majority non-Hispanic white schools must be gender and culturally sensitive to be effective. Additionally, school nutritionists and counselors should ideally collaborate to provide race and gender specific guidelines that will insist in achieving healthy lifestyle modification and improve quality of life.
Human Subjects Approval Statement
The university Institutional Review Board (IRB) approved this study prior to data collection. Participation was voluntary and written informed consent was obtained from all subjects and their parents prior to testing.
Competing Interest Disclosure Statement:
All authors of this article declare they have no competing interest.
References
Talen, M. & Mann, M. (2009). Obesity and mental health. Primary Care: Clinics in Office Practice, 36(2), 287-305. View
Florin, T., Shults, J. & Stettler, N. (2010). Perception of overweight is associated with poor academic performance in US adolescents. Journal of School Health, 81(11), 663-670.View
Lee, H., Andrew, M., Gebremariam, A., et al. (2014). Longitudinal associations between poverty and obesity from birth through adolescence. American Journal of Public Health.104(5), 70-76.View
Eaton, D., Lowry, R., Brener, N., et al. (2005). Associations of body mass index and perceived weight with suicide ideation and suicide attempts among US high school students. Archives of Pediatric and Adolescent Medicine. 159, 513-519.View
Paxton, S., Neumark-Sztainer, D., Hannan, P., et al. (2006). Body dissatisfaction prospectively predicts depressive mood and low self-esteem in adolescent girls and boys. Journal of Clinical Child and Adolescent Psychology. 35(4), 539-549. View
Ter Bogt. T., van Dorsselaer, S., Monshouwer, K., et al. (2006). Body mass index and body weight perception as risk factors for internalizing and externalizing problem behavior among adolescents. Journal of Adolescent Health. 39 (1), 27-34.View
Krukowski, R., West, D., Perez, A., et al. (2009). Over-weight children, weight-based teasing and academic performance. International Journal of Pediatric Obesity. 4, 274-280.View
Story, R. (2004). Asthma and obesity in children. Current Opinion in Pediatrics. 19(6), 680-684.
Muhammad, S. (2004). Epidemiology of diabetes and obesity in the United States. Compendium of Continuing Education in Dentistry. 25(3), 195-198.View
Bethel, C., Simpson, L., Stumbo, S., et al. (2010). National, state, and local disparities in childhood obesity. Health Affairs. 29(3), 347-356. View
McClure, A., Tanski, S., Kingsbury, J., et al. (2010). Characteristics associated with low self-esteem among US adolescents. Academic Pediatrics. 10(4), 238-244.View
Medeiros, S., Enes, C., & Nucci, L. (2022). Association of weight perception, body satisfaction, and weight loss intention with patterns of health risk behaviors in adolescents with overweight and obesity. Behavioral Medicine. 1-10. View
Hendley, Y., Zhao, L., Coverson, D., et al. (2011). Differences in weight perception among blacks and whites. Journal of Women’s Health. 20(12), 1805-1811. View
Basch, C. (2011). Physical activity and the achievement gap among urban minority youth. Journal of School Health. 81, 626-634. View
Mikkila, V., Lahti-Koski, M., Pietinen, P., et al. (2003). Associates of obesity and weight dissatisfaction among Finnish adolescents. Public Health Nutrition. 6(1), 49-56.View
Clark, D., Slate, J., & Viglietti, G. (2009). Children’s weight and academic performance in elementary school: Cause for concern? Analyses of Social Issues & Public Policy. 9(1), 185 204.View
MacCann, C., & Roberts, R. (2013). Just as smart but not as successful: Obese students obtain lower school grades but equivalent test scores to nonobese students. International Journal of Obesity. 37(1), 40-46. View
Duncan, C., & Murnane, R. (2011). Whither opportunity: Rising inequality and the uncertain life chances of low-income children. New York: Russell Sage Foundation. 129,483. View
Reardon, S. (2011). The widening academic achievement gap between the rick and the poor: new evidence and possible explanations. New York: Russell Sage Foundation. 11-12.View
Tyler, J., & Lofstrom, M. (2009). Finishing high school; Alternative pathways and dropout recovery. Future of Children. 19, 77-103. View
Atlanta Pubic Schools Page. Fast Facts 2013-2014 (online). Available at: http://www.atlanta.k12.ga.us/Domain/35. Accessed February 15, 2013. View
Harrington, D., Staiano, A., Broyles, S., et al. (2013). BMI percentiles for the identification of abdominal obesity and metabolic risk in children and adolescents: evidence in support of the CDC 95th percentile. European Journal of Clinical Nutrition. 67, 218-222. View
Ogden, C., Carroll, M., Kit, B., & Flegal, K. (2014). Prevalence of Childhood and Adult Obesity in the United States, 2011 2012. JAMA. 311(8):806–814. View
Wang, Y., & Chen, H. (2012). Use of percentiles and Z-scores in anthropometry. Handbook of anthropometry: Physical measures of human form in health and disease. Baltimore: Springer Science+Business Media. 29-48.View
Ramaswamy, R., Mirochna, M., & Perlmuter, L. (2010). The negative association of BMI with classroom effort in elementary school children. Journal of Child Health. 14(2), 161-169.View
Barlow, S. (2007). Expert committee recommendations regarding the prevention, assessment, and treatment of child and adolescent overweight and obesity: summary report. Pediatric. 120, 164-192. View
Zavodny, M. (2016). Does weight affect children’s test scores and teacher assessments differently? Economics of education review. 34, 135-145.
Castelli, D., Hillman, C., Buck, S., et al. (2007). Physical fitness and academic achievement in third- and fifth-grade students. Journal of Sport & Exercise Psychology. 29(2), 239-252.View
Connor-Greene, P. (2008). Gender differences in body weight perception and weight-loss strategies of college students. Women & Health. 14(2), 27-42.View
Furnham, A., Badmin, N., & Sneade, I. (2002). Body dissatisfaction: Gender differences in eating attitudes, self esteem, and reasons for exercise. The Journal of Psychology: Interdisplinary and Applied. 136(6), 581-596.View
McNamara, C., Hay, P., Katsikitis, M., et al. (2008). Emotional responses to food, body dissatisfaction and other eating disorder features in children, adolescents and young adults. Appetite. 50(1), 102-109. View
Park, E. (2010). Overestimation and Underestimation: Adolescents’ weight perception in comparison to BMI-based weight status and how it varies across socio-demographic factors. Journal of School Health. 81, 57-64. View