
- About the Journal
- Editorial Board
- Review Process
- Author Guidelines
- Article Processing Charges
- Special Issues
- Indexing
- Current Issue
- Past Issue
 Journal of Public Health Issues and Practices
Journal of Public Health Issues and Practices Volume 9 (2025), Article ID: JPHIP-232
https://doi.org/10.33790/jphip1100232Commentary Article
An Examination of Health Department Accreditation on Health Outcomes: Commentary and Recommendations
David M. Remmert1*, Thomas O’Rourke2
1School of Nursing and Health Sciences, Illinois Wesleyan University, Bloomington, Illinois, United States.
2Department of Health and Kinesiology, University of Illinois, United States
*Corresponding Author Details: David M. Remmert, M.P.H., Ph.D, Assistant Professor, Department of Public Health, School of Nursing, Illinois Wesleyan University, C008A Center for Natural Science, PO Box 2900, Bloomington, IL 61702-2900, United States.
Received date: 03rd January, 2025
Accepted date: 18th February, 2025
Published date: 20th February, 2025
Citation: Remmert, D. M., & O’Rourke, T., (2025). An Examination of Health Department Accreditation on Health Outcomes: Commentary and Recommendations. J Pub Health Issue Pract 9(1): 232.
Copyright: ©2025, This is an open-access article distributed under the terms of the Creative Commons Attribution License, which permits unrestricted use, distribution, and reproduction in any medium, provided the original author and source are credited.
Abstract
Context: Throughout their public documents, the Public Health Accreditation Board (PHAB) has explicitly stated and implicitly suggested an association between accreditation and population health outcomes. While there is agreement of the inherent value in quality assurance and performance management efforts, there has been no attempt to measure this particular claim. The purpose of this study is to assess if there is a difference between accreditation status of local public health agencies (LPHAs) and population health outcomes. In addition, comments and recommendations are offered to further advance performance management and quality improvement efforts within LPHAs.
Design: Using a posttest only non-equivalent groups designed (NEGS) study, accredited or re-accredited LPHAs between 2020 and 2024 and serving a county-specific jurisdiction were randomly matched with a non-accredited peer group. The dependent variables in this study included four widely cited health outcome measures readily accessible from online sources. To determine if a difference exists in these outcomes based on accreditation status, an Independent Samples t-test was used. In order to improve validity, we also assessed the impact of several potentially confounding socio-economic variables.
Results: In each of the four population health outcomes noted, no significant difference exists based on accreditation status. Accredited LPHAs were no different than non-accredited LPHAs in terms of their health outcomes. Additionally, no significant differences were noted between several potentially confounding socio-economic variables that could impact health outcomes.
Conclusions: Although quality improvement efforts within LPHAs are important, there does not appear to be any association between accreditation status and population health outcomes. While the tenets of the traditional logic model as an organizing framework appear valid, they don’t appear to relate well in this particular application. Commentary and recommendations are provided which discuss how PHAB might adapt to a broader role in LPHA evaluative efforts that may provide more meaning at identifying excellence.
Keywords: Local Health Department, Quality Assurance, Accreditation, Population Health, Performance Measurement
Introduction
Quality improvement methods exist in multiple industries and serve multiple purposes. Many of these methods are informal and organizationally directed, while others are formal processes often directed by governing bodies with specific standards. These methods may take many different forms with many different models. Some of the better known models include Six Sigma, ISO, the Baldrige Award, and others [1]. Within health care, academia, and public health organizations, this performance management function has become more formal and may take the form of “certification” or “accreditation.” Within the public health field, accreditation is held in high regard, with user surveys and Public Health Accreditation Board (PHAB) documents citing multiple benefits [2]. PHAB documents published in July 2023 [3], for example, cite numerous references to aggregated perception data collected as part of end user surveys.
However, the purpose of research often is to pursue new methods in order to advance beyond the status quo. Despite repeated claims in end user surveys found in PHABs public documents of an association between accreditation status and health outcomes, this assertion has not been assessed. Certainly, the literature is replete with acknowledgement of the value and impact of accreditation yet, in order to advance this model, can accredited local public health agencies (LPHAs) demonstrate any measurable return on investment that make them different and better than other LPHAs that are not certified or accredited? What is the utility cost of choosing accreditation over any other potentially meaningful performance management model? Can “good” or “strong” local health departments exist that are not accredited or are receiving accreditation? What defines a “good” vs “bad” health department? Can the accreditation model in use within LPHAs show such an association? It was said many years ago, “emerging public health standards, performance assessment tools, and accreditation models hold significant promise for defining and standardizing public health practice, yet the lack of empirical research on their relationship to outcomes represents a serious barrier to adoption” [4]. This empirical data remains elusive.
The Logic Model as an Evaluative Framework
In 2011, the Public Health Accreditation Board launched a new model of performance improvement for LPHAs based largely on the tenets of the Logic Model. The Logic Model is a representation of how an organization’s resources or inputs should ultimately relate to their intended results. The W.K. Kellogg Foundation provided a graphical representation of this model noted below in Figure 1. Central to this conceptual evaluation framework is the relationship of an organizations’ inputs (which include the human, financial, organizational, and sometimes community resources a program has available to direct toward doing the work) to the intended results including its processes, outputs (i.e., the services to be delivered by the program) and outcomes [5]. Dykeman, et al. noted that logic models assist evaluation by linking program interventions with intended outcomes. By developing such a conceptual framework, it becomes easier to clearly delineate the links between the many desired outcomes, the processes leading to those outcomes, and the measurable indicators necessary to provide the rich data needed to evaluate the outcomes [6].
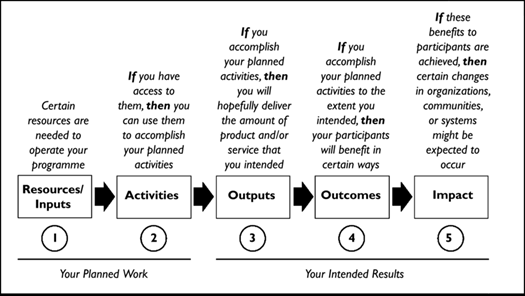
Figure 1. W.K. Kellogg Foundation Logic Model
LPHA Accreditation
These “inputs” are the focus of the voluntary accreditation model offered by the Public Health Accreditation Board (PHAB). According to the PHAB Standards & Measures document [7] accreditation involves focus on ten Domains or groups of standards that pertain to a broad group of public health services [3]. The ten domains address the ten Essential Public Health Services. As such, accreditation as described here focuses on “Your Planned Work” of Resources/Inputs and Activities noted in Figure 1. According to email communication with PHAB received on 7/8/2024, as of May 2024 PHAB accredits 441 local, tribal, and state health departments. Over time, 468 have been in process with one department that was reviewed but failed to meet requirements or continue in the probationary review process and 26 departments that were initially accredited, but did not apply for re-accreditation.
According to one source, getting accredited is not easy. It can take up to 18 months and be considered costly with fees ranging from $12,720 to $95,400 – depending on the number of people the department serves. Surveys show that limited staff, staff turnover and fees are the biggest barriers to national accreditation [8]. There are more than 3300 agencies or units that meet the National Association of County and City Health Officials definition of a local health department [9], indicating only about 13 percent of LPHAs participate in the accreditation process.
The idea for a national public health accreditation board was born in 2005 when the CDC and the Robert Wood Johnson Foundation teamed up to create one. The PHAB website boasts a rather extensive bibliography (https://phaboard.org/wp-content/uploads/Research- Resources.pdf) with research articles grouped in thematic areas of Impact of Accreditation; Applicant Characteristics, Facilitators, Incentives, and Barriers; Stories from Health Departments; Standards and Measures; Research and Academics; Related Initiatives; and Background and History of Accreditation. These articles often focus on accreditation processes, perceptions of participating public health agencies including both challenges and benefits, and in some cases the impact of accreditation on levels of engagement and partnerships.
Perhaps the most extensive summary of the public health accreditation model was completed in July 2023 and described in the document, “The Value and Impact of Public Health Department Accreditation” found here [3]. This report was compiled after thorough review of the data gathered to date, along with contextual information and included a variety of data sources, including findings from surveys conducted by NORC at the University of Chicago, research findings from both comparative and longitudinal studies, and numerous case studies and narratives. From this review, seven themes emerged that focused upon how accreditation impacted Quality Improvement, Partnerships, Accountability, Workforce, Resources, Community Health/Equity, and Emergency Preparedness [3].
Notably absent from this bibliography however is research linking a local public health agency’s inputs or resources to outputs and outcomes, that is how these processes ultimately impact the mission of the organization that might include the impact on population health outcomes. Additionally, there remains a gap in the literature identifying how accredited LPHAs may differ from non-accredited LPHAs. More work needs to be done to bridge these gaps.
Accreditation Processes in Other Fields
Accreditation processes in place for other fields including healthcare and academia, for example, have been critical on the question of how accreditation matters to outcomes of interest. A study by Lam, et al. [10] noted, for example, that there was no evidence of lower mortality in accredited hospitals and that accreditation was only slightly associated with reduced readmission rates for 15 common medical conditions included in the study [10]. In academia, colleges and universities must receive recognition from an accreditor to receive federal student aid yet regional accreditors don’t connect outcome data to standards. Without linking long-term data collection to standards, accreditors are unable to hold colleges accountable for what the data show. Unable to show that accreditation relates to better graduation rates, news coverage about higher education’s gatekeepers for federal student aid shifted notably in 2016, with accreditation bodies being portrayed as lax and derelict in their duty in multiple headlines [11, 12]. Unless evidence toward achieving population health outcomes is found, might a similar fate befall the PHAB?
Purpose
Using a posttest only non-equivalent groups designed (NEGS) study [13], the purpose of this study is to assess if there is a difference between accreditation status of the LPHA and population health outcomes. If a difference exists, statistical testing can be done to measure the strength of association between variables. If significant positive statistical differences in population health outcomes are noted this would validate accreditation and encourage participation by additional LPHAs. This study seeks to advance the field of public health by aiding professionals toward a deeper understanding of the associations between LPHA quality assurance efforts specifically and performance management strategies generally.
Additionally, this study relates directly to the PHAB 2021 research agenda focusing on question #6: What is the impact of health department accreditation on health outcomes and health equity? [14].
Materials and Methods
Due to the nature of the outcome data being county-specific, for the purposes of this study, only county local public health agencies were included. All international, military, tribal, VRHS agencies (vital records/health statistics), municipal/city/district, and state accredited public health agencies were excluded from participation (n=150). Additionally, because of any temporal issues that could potentially confound the association between variables, only LPHAs that were accredited or re-accredited between 2020 and 2024 were included in the study. In order to assess if there is a difference in population health outcomes between accredited and non-accredited LPHA counties, the authors utilized an independent samples t-test that matched all county jurisdictional LPHAs that were accredited or re-accredited between 2020 and 2024 (n=210) to nonaccredited peer county LPHAs. The peer county group came from the County Health Rankings and Roadmaps resource (https://www. countyhealthrankings.org/resources/peer-counties-tool-accessed 5/30/2024). The County Health Rankings website allows users to select a “Peer Counties Tool” which, when selected, provides information on a group of counties that could be considered peers based on key demographic, social, and economic indicators. All accredited LPHA counties were matched with a peer county from this resource of non-accredited LPHA counties, meaning that they closely resembled the key demographic, social, and economic markers of each accredited LPHA county. From this group of peer counties, counties having an accredited or re-accredited LPHA were removed, leaving a matched group of all counties having a non-accredited LPHA. The Random function (“RAND()”) was then used within this Excel file to allow for random selection of peer non-accredited LPHA counties.
Realizing previous research has demonstrated that demographic, socioeconomic and other social determinants of health impact health outcomes at the individual and population level, the authors tested how well the counties were matched on the basis of several potential confounding variables. These variables included HS Completion (%), Unemployment (%), Children in Poverty (%), and Income Inequality (defined as the ratio of household income at the 80th percentile to income at the 20th percentile). These tests were performed by evaluating the 210 counties with an accredited LPHA, to all other US counties with non-accredited LPHAs using a two-sample t-test assuming equal variances. All data came from the County Health Rankings website in a CSV (Excel) file.
To evaluate the association on population health status between counties having an accredited LPHA vs non-accredited LPHA, we reviewed a number of frequently used and widely cited health outcome measures that have been used to measure health status of populations. The Organization for Economic Cooperation and Development (OECD), for example, includes several health measures used internationally to determine the health status of countries across the world [15]. These outcome measures included the infant mortality rate, life expectancy, and Years of Potential Life Lost at age 75. In addition, we added one other measure: the percent of the population self-reporting health as ‘fair’ or ‘poor,’ All of these measures were available online via the County Health Rankings and Roadmaps website in a CSV file (https://www.countyhealthrankings. org/health-data/methodology-and-sources/data-documentation). Due to some missing data present in the infant mortality indicator, a t-test was run both with initial randomly matched counties, and again with a new set of randomly matched counties that had infant mortality rates intact. Often, infant mortality data are not calculated in less populated counties due to the small number of cases of infant deaths in those counties.
Results
In order to test the matching design with peer counties and add validity to the study, the authors ran additional tests on several socioeconomic indicators that could serve as potential confounding variables. In these tests, all of the accredited LPHA counties meeting the study criteria (n=210) were compared to all non-accredited LPHA counties. As noted earlier, the indicators of study included HS Completion (%), Unemployment (%), Children in Poverty (%), and Income Inequality. In these tests, no significant differences existed between those counties having an accredited LPHA and those counties not having an accredited LPHA, indicating that the methodology the authors employed to match these counties using a peer county was valid. These results are located Table 1.
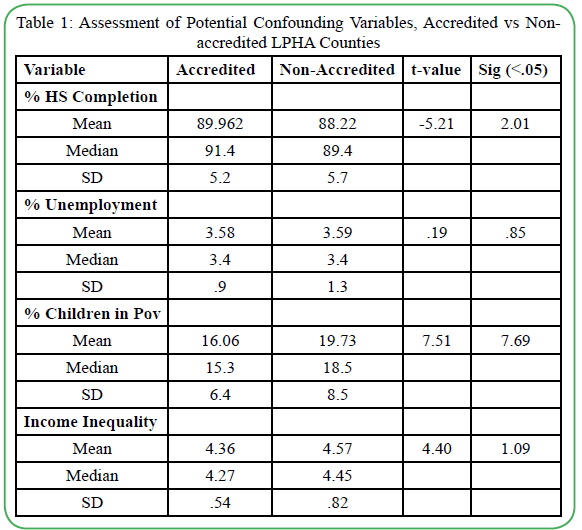
Table 1. Assessment of Potential Confounding Variables, Accredited vs Nonaccredited LPHA Counties.
All accredited LPHA counties meeting the study criteria (n=210) were compared to a randomly matched non-accredited peer county and an independent samples t-test was performed to determine if there was a significant difference between counties. The dependent variable was population health outcomes that included Years of Potential Life Lost at age 75, percent of the population self-reporting “fair” or “poor” health, life expectancy, and infant mortality rate. Results are as follows:
Years of Potential Life Lost at age 75 (YPLL): 210 counties with Accredited LPHAs (M=8855.0, SD=2419.8) were compared to 209 matched counties with Non-Accredited LPHAs (M=8840.9, SD=2730.8). No significant difference in YPLL was found between counties having an accredited LPHA vs those counties not having an accredited LPHA, t (417) =.056, p=.96.
Percent of the Population Self-Reporting “Fair” or “Poor” Health: 210 counties with Accredited LPHAs (M=16.4%, SD=.034) were compared to 210 counties with Non-Accredited LPHAs (M=16.6%, SD=.039). No significant difference was found in the percent of the population self-reporting “fair” or “poor” health, t (418) = -.63, p=.53, between counties having an accredited LPHA vs those counties not having an accredited LPHA.
Life Expectancy: 210 counties with Accredited LPHAs (M=76.8, SD=2.8) were compared to 208 counties with Non-Accredited LPHAs (M=76.7, SD=3.1). No significant difference in life expectancy was found between counties having an accredited LPHA vs those counties not having an accredited LPHA, t (416) =.38, p=.71.
Infant Mortality Rate: 163 counties with Accredited LPHAs (M=6.1, SD=1.6) were compared to 130 counties with Non-Accredited LPHAs (M=6.0, SD=1.8). No significant difference was found in infant mortality rate between counties having an accredited LPHA vs those counties not having an accredited LPHA, t (291) =.53, p=.60.
Due to the lack of data existing in many of the randomly selected non-accredited peer counties, the independent samples t-test was run again with additional randomly selected peer counties that had infant mortality rates intact. In this test, 163 counties with Accredited LPHAs (M=6.1, SD=1.6) were compared to 195 counties with Non- Accredited LPHAs (M=6.1, SD=1.9). Again, in this additional t-test, no significant difference was found in infant mortality rate, t (356)= -.16, p=.87.
Limitations
The purpose of this study was to test the hypothesis that there is an association between LPHA accreditation status and population health outcomes. These claims are suggested in multiple locations in PHAB documents, yet have never been assessed. Assessing this possible association was suggested in literature [4] shortly after the LPHA Accreditation model began through PHAB. Additionally, this research is meant to comply with PHABs research agenda [14]. This study was meant to close this gap.
This study is a commentary for discussion and was not intended to account for the milieu of different variables that play some role in influencing population health outcomes, as the socio-ecological model might suggest. The authors understand and concur that many different social determinants of health help to explain differences in health status overall. However, this study helps clarify that the accreditation status of the county LPHA does not differentiate between outcomes.
In addition, this study uses one methodology to examine LPHA accreditation status against a dependent variable defining population health outcomes. The study uses common population health outcome measures found in other research. It does not imply that these are the only measures of population health outcomes that could have been used. Other measures, both intermediate and long-term, could have been used to measure possible association between variables. For example, future research may investigate possible associations on more intermediate goals such as LPHA outputs, namely the core public health functions of assessment, policy development, and assurance, identified by the Institute of Medicine report, The Future of Public Health (1988).
Similarly, the impact of demographic, socioeconomic and other social determinants of health impact health outcomes at the individual and population level needs to be acknowledged as potentially confounding variables. In order to test the validity of a matched peer county design, we assessed the impact of four widely used socioeconomic variables (HS completion %, Unemployment %, Children in Poverty %, and Income Inequality) known to relate to health status overall. Although our results found no differences between counties having an accredited vs. non- accredited LPHA, we do not imply these variables as exhaustive, nor that our study design was potentially superior to other study designs. In addition, we acknowledge that there may be temporal issues that play some factor in the results shown. That is, it is not known how long after accreditation has been awarded that one might expect to see some sort of result in the outcome of interest, if any. A longer period of study may evidence longer term effects.
This study focused on accreditation status and health outcomes. However, accreditation may have other beneficial effects not assessed in this study, such as those noted in other research highlighted in the Value and Impact of Public Health Accreditation [3] document. These may include quality service improvement, enhanced community partnerships and public accountability, a more competent workforce and better emergency preparedness.
Discussion and Conclusions
PHAB documents infer that accreditation leads to improved population health. PHAB notes, for example: “…accredited health departments identify the following benefits associated with their QI culture…improved public health outcomes (32%)” [3] and “accreditation has been associated with achieving the tenets of a comprehensive public health system. Other studies have linked this type of multisector population health partnership with reductions in mortality rates for preventable conditions and reductions in incomerelated disparities in life expectancy” [3]. End-user surveys collected by PHAB have further noted “51% agree that health department activities implemented as a result of being accredited have led to improved health outcomes in the community” [3]. Since 2011, public health accreditation has offered the field the most comprehensive, organized quality improvement process to date. Yet, 13 years after its inception, few LPHAs are accredited and significant questions remain with regard to its validity and utility. While associations to population health outcomes are repeatedly inferred in PHABs public documents, no empirical evidence exists to validate those claims.
PHAB reports that all but one of the LPHAs that has applied for accreditation has achieved the governing body standards. If these standards are so easily attainable, what difference does it really make to achieve accreditation? Does satisfying a series of basic checkoff boxes really define a ‘good’ vs. ‘poor’ LPHA? If every LPHA regardless of accreditation status effectively meets the standards, does accreditation really matter? Resources, both financial and human, are often limited in government organizations, forcing governing boards to decide amongst competing priorities. Are those LPHAs that cannot afford accreditation, or making a conscious decision to put all of their financial and human resources into population-based services somehow less valid or unworthy of acclaim even though this evidence suggests they may operate equally as well? While the tenets of the traditional logic model as an organizing framework appear valid, absent empirical evidence, they don’t appear to relate well in this particular application.
The Opportunity Cost of Accreditation: The Ongoing Search for ‘What Works’
By no means should this research appear to be a denunciation of accreditation. There is value and worth to these efforts for multiple purposes. The work of PHAB offers meaningful insight into performance management of LPHAs and provides an organized, grounded method and appropriate structure by which to pursue performance measurement. However, absent empirical evidence, an association between accreditation and population health outcomes should not be suggested. Instead, while this model offers benefit, it should not be promoted as the only worthwhile effort at quality assurance or performance management within LPHAs. Many LPHAs, including those in Illinois, engage in a statewide “certification” process, for example, that creates a “certified local health department” and is required to enable that agency to be eligible to receive state funding (https://app.idph.state.il.us/ accessed 12/27/2024). The CDC notes multiple resources for performance management and quality improvement efforts, as well [2].
Opportunity cost is defined as the value of the next best alternative forgone [16]. By choosing accreditation, there is an opportunity cost. Is there an alternative to accreditation that might yield better results? More research is needed to fully understand how accredited LPHAs differ from non-accredited LPHAs. Despite the 13-year history of PHAB, there is a profound gap in the literature that distinguishes between these two types of entities. The research provided through this study has noted there does not appear, at least in terms of population health outcomes, there is any difference. Ohio has now mandated LPHA accreditation through the PHAB standards but unless a difference can be noted between accredited vs. nonaccredited LPHAs, is this an example of responsible government stewardship? The expense of accreditation noted by Quinn [8] is also an opportunity cost, and the alternative is that those funds could’ve been spent providing direct services to populations in need.
Recommendations
- More research is needed to assess the differences between accredited vs. non-accredited LPHAs. If no differences can be noted, as the results of this study have found, then some consideration is warranted to suspend accreditation efforts until evidence warrants such endorsement. This is especially true given LPHA limited resources. User surveys simply are not enough to determine validity and utility of this performance measurement effort.
- Accreditation/Certification models through PHAB and others should pivot to standards that are inclusive of population health outcomes and/or show a measurable difference in outputs/ outcomes between accredited vs non-accredited LPHAs. If the logic model is deemed a valid organizing framework, research should continually search for what works in LPHA practice. This would include empirically linking an LPHAs planned work (resources/inputs) to the other tenets of a typical logic model (outputs, outcomes, impact). Performance evaluation should show LPHAs advancing the link between what a LPHA does and how it matters to population health. Governing bodies that oversee LPHAs as well as funders who provide grants to improve population health outcomes for targeted audiences are most interested in that bottom-line. Growing evidence, for example, shows a link between robust state health policies to health outcomes [17], yet very little evidence exists that shows concretely how LPHAs advance this advocacy mission of public health.
- Models of performance measurement in Public Health through PHAB and others should not limit themselves to setting standards that perhaps all could reach, but should also be able to identify superior performers within the field. By identifying certain LPHAs as superior performers, as in a Benchmarking method, those identified as superior can then serve as models for others within their same peer group. As measures are set and superior performers are identified, additional research questions become evident.
- While quality improvement efforts are important, more effort is needed to search for both a link between a LPHAs efforts to population health outcomes, and a better understanding of the difference between an accredited vs non-accredited LPHAs. PHABs recent hiring of a new Executive Director, provides an excellent opportunity for PHAB to adapt and grow further. Providing consideration to other metrics of performance measurement might add meaning to what has already been done with accreditation. PHAB is well-positioned to expand into all avenues of quality improvement and performance measurement. These efforts will enhance credibility and participation and advance the field.
Implications for Policy and Practice
Several results from this study may provide guidance for the field:
- Efforts to date to advance the quality assurance/performance measurement mission have focused largely on what Turnock [18] referred to as the public health inputs contributing to the public health system’s capacity: the human, informational, financial, and organizational resources a LPHA has available to direct toward doing the work. Little research thus far has attempted to link these inputs to the intended results including population health outcomes.
- While the logic model provides an organizing framework for evaluation efforts, the tenets of the logic model (inputs/ resources, activities, outputs, outcome) do not appear to correlate in meaningful ways toward the bottom line for LPHAs: population health.
- While quality improvement efforts are important, more effort is needed to search for both a link between a LPHAs efforts to population health outcomes, and a better understanding of the difference between an accredited vs non-accredited LPHA. Practitioners and scholars across a variety of disciplines recognize good project management goes beyond implementation. They acknowledge that effective project management is integrally linked to well-designed monitoring and evaluation. More is needed to advance the field.
Conflict of interest
The authors declare that they have no competing interests.
List of Abbreviations:
PHAB (Public Health Accreditation Board); LPHAs (Local Public Health Agencies); NEGS (Non- Equivalent Groups Design); OECD (Organization for Economic Cooperation and Development.
Acknowledgements
The authors thank Dr. Tim Johnson, Professor Emeritus, University of Illinois at Chicago for his counsel for this Commentary.
Funding
No funding was received to support this research.
Financial Disclosure
The authors have no financial relationships relevant to this submitted work.
Human Participation Compliance Statement
All data included in this study was from secondary sources. No ethical approval was needed for this research.
References
Edureka higherEd. (2024, September 25). Models of quality assurance: Definition, meaning & frameworks. .View
Centers for Disease Control and Prevention. (2024, May 15). Accreditation: Benefits & impacts. U.S. Department of Health and Human Services. View
Public Health Accreditation Board. (2023). The value and impact of public health accreditation. View
Joly, B.M., Polyak, G., Davis, M.V., Brewster, J., Tremain, B., Raevsky, C., Beitsch, L.M. (2007). Linking accreditation and public health outcomes: A logic model approach. J Public Health Management Practice, 13(4), 349-356. https://doi. org/10.1097/01.PHH.0000278027.56820.7e.View
W.K. Kellogg Foundation. (2004). Logic model development guide. View
Dykeman, M., MacIntosh, J., Seaman, P., Davidson, P. (2003). Development of a program logic model to measure the processes and outcomes of a nurse-managed community health clinic. J of Prof Nursing, 19(3), 197-203. View
Public Health Accreditation Board. (2022). Standards & Measures: Version 2022. View
Quinn, M. (2016, January 4). Unlike zoos, public health departments don’t need national accreditation. View
Cunningham, M., Patel, K., McCall, T., et al. (2024). 2022 National Profile of Local Health Departments. National Association of County and City Health Officials. Washington, DC. View
Lam, M.B., Figueroa, J.F., Feyman, Y., Reimold, K.E., Orav, E.J., Jha, A.K. (2018). Association between patient outcomes and accreditation in US hospitals: Observational study. BMJ, 363:k4011. View
Flores, A. (2018). How college accreditors miss the mark on student outcomes. Center for American Progress. View
Cooper, P. (2023). College accreditation does not guarantee good student outcomes. View
Shadish, W.R., Cook, T.D., & Campbell, D.T. (2002). Experimental and quasi-experimental designs for generalized causal inference. Boston, MA: Houghton, Mifflin and Company.View
Public Health Accreditation Board. (2021). Logic model and research agenda.View
Organization for Economic Cooperation and Development. (2023). Health at a glance: 2023. View
Carpenter, A. (2023, December 11). Opportunity cost definition. US News and World Report. View
Remmert, D.M., & O’Rourke, T. (2024). T. How hazardous is your state to your health. Am J Health Ed. 55(1), 1-13. View
Turnock, B. (2001). Public health: What it is and how it works. Gaithersburg, MD: Aspen Publishers, Inc.