
- About the Journal
- Editorial Board
- Review Process
- Author Guidelines
- Article Processing Charges
- Special Issues
- Indexing
- Current Issue
- Past Issue
 Journal of Public Health Issues and Practices
Journal of Public Health Issues and Practices Volume 10 (2026), Article ID: JPHIP-251
https://doi.org/10.33790/jphip1100251Research Article
Hardship and Obesity: A Cross-Sectional Ecological Analysis in Chicagoland Adults
Eddie Silber1*, Caitlyn Zon2, and Faisal Alhaifi3
Illinois Institute of Technology, 10 West 35th Street Chicago, IL 60616, United States.
Corresponding Author Details: Eddie Silber, Illinois Institute of Technology, 10 West 35th Street Chicago, IL 60616, United States.
Received date: 14th January, 2026
Accepted date: 11st February, 2026
Published date: 13th February, 2026
Citation: Silber, E., Zon, C., & Alhaifi, F.,(2026). Hardship and Obesity: A Cross-Sectional Ecological Analysis in Chicagoland Adults. J Pub Health Issue Pract 10(1): 251.
Copyright: ©2026, This is an open-access article distributed under the terms of the Creative Commons Attribution License, which permits unrestricted use, distribution, and reproduction in any medium, provided the original author and source are credited.
Abstract
Obesity remains a major public health concern in the United States, with disproportionately high prevalence in urban, low socioeconomic status (SES) communities. Chicago communities, particularly those on the South and West sides, experience elevated rates of both economic hardship and obesity. The present study used a cross-sectional ecological design to examine the relationship between socioeconomic hardship and adult obesity rates in Chicago, and evaluated physical inactivity as a mediator. Using publicly available data from the Chicago Health Atlas, secondary analyses were conducted across 75 Chicago community areas (N = 75). Community-level hardship was operationalized using the Chicago Hardship Index, obesity was measured as the percentage of adults with a body mass index of 30 or greater, and physical inactivity was defined as the percentage of adults reporting no physical activity in the past month. Bivariate correlations and a mediation model were tested using Hayes’ PROCESS Macro. Results indicated that hardship was positively associated with obesity and physical inactivity. Physical inactivity significantly mediated the relationship between hardship and obesity, accounting for a substantial proportion of the association while retaining a significant direct effect. Additional correlational analyses revealed higher obesity rates in communities with larger proportions of Black residents and females, highlighting intersecting social inequities. Guided by Maslow’s Hierarchy of Needs, findings suggest that unmet basic and safety needs in economically disadvantaged communities may impede engagement in health-promoting behaviors such as physical activity. These results highlight the importance of addressing structural and environmental barriers to physical activity when designing obesity prevention strategies. Policy and community-level interventions that target economic hardship and promote accessible opportunities for physical activity may be critical for reducing obesity-related health disparities in urban populations.
Introduction
According to the Centers for Disease Control and Prevention (CDC), from the years 2000 to 2020, adult obesity rates in the United States grew 11% [1]. Obesity, defined as an abnormal or excessive fat accumulation, has been linked to many adverse health outcomes such as cardiovascular disease, diabetes, and various types of cancer [2]. Diagnostically, an individual with a body mass index (BMI) over 30 is considered obese. Current research suggests that 61.2% of adults in the Chicago metropolitan area are either overweight or obese [3].
The current study will seek to understand explanatory reasons for the disproportionally high rates of obesity in Chicago communities. Specifically, we investigate physical inactivity as a mediator to explain the relationship between low socioeconomic status (SES) and obesity rates. In the following paragraphs we describe how the present study addresses important gaps in the current obesity literature.
Obesity and low socioeconomic status
Low SES usually refers to individuals with low educational achievement and/or low household income [4]. It is important to study obesity and its relation to poverty, as those of lower SES are at risk for developing obesity and other chronic health conditions [5]. Current research suggests that 43% of households living in poverty-dense areas, oftentimes called “food deserts,” report feelings of food insecurity [6]. Factors such as cost of eating healthy and access to supermarkets have been linked to food insecurity, ultimately lowering the quality of diets for individuals in these communities [7]. Compared to 12.8% for the general U.S, 17.1% of the Chicago population lives in poverty [8]. Given that individuals living in Chicago experience higher poverty rates than the general U.S population, further research focusing on poverty and obesity in this location is warranted.
Physical inactivity, low SES, and obesity
Adults are recommended to engage in 150 minutes of moderate-intense physical activity per week [9]. Although the health benefits associated with engaging in a physically active lifestyle is extensive, 31% of the world’s population are not meeting physical activity recommendation levels [10]. Recently, research found a link between physical inactivity and COVID-19 complications. Specifically, inactive individuals with COVID-19 were at greater risk for hospitalization, admission to the ICU, and death [11]. Furthermore, 6-10% of all non-communicable disease deaths can be attributable to physical inactivity [12].
Low SES and physical inactivity share a positive relationship [13]. Several reasons may explain why people living in low income communities are less active. Gray et al. [14] suggests that poor environmental quality exacerbates the inactivity-obesity relationship. Specifically, air, water, land, and sociodemographic quality were found to modify the relationship between physical inactivity and obesity [14]. In addition, individuals living in poverty-dense regions may be less able to afford a gym membership or personal exercise equipment, and have limited access to parks and sport facilities [15].
In Chicago communities the rates of obesity and poverty disproportionally affect South and West neighborhoods [16]. Specifically, low-income, unemployment, criminal activity, vacant homes, severe rents, and high evictions rates are highest in southern and western communities. In these communities, poverty was found to be the most important variable contributing to obesity per census tract. Results also suggest that there is a positive association between eviction rate, severe rent, unemployment, crime, poverty, and obesity. The relationship between socioeconomic status and physical activity in Chicago communities is not well established and requires further research [16].
Intersectionality
Intersectionality refers to the idea that individuals are shaped by multiple social identities, including race and gender, and that those identities should not be examined separately [17]. In the context of obesity, substantial racial and gender disparities persist, with Black women consistently demonstrating the highest rates of obesity in the United States [4,18]. Longitudinal research further indicates significantly greater weight gain among Black women compared to White women, with smaller differences observed among men [19]. These disparities are situated within broader structural inequities, as poverty and economic hardship disproportionately affect communities of color [20], and individuals of color experience greater increases in BMI across the lifespan [21]. Given this evidence, the present study included race and gender in the correlation matrix to examine whether community-level percentages of residents identifying as Black and female were associated with hardship, physical inactivity, and obesity rates.
Theoretical Framework: Maslow’s Hierarchy of Needs
Maslow’s theory of need fulfillment proposes that individuals must adequately meet basic physiological and safety needs before they are able to prioritize higher order goals and self-directed growth [22]. Applied to socioeconomic conditions, individuals living in low SES environments may struggle to secure stable housing, employment, financial security, and neighborhood safety [23]. When these foundational needs remain unmet, engagement in health promoting behaviors such as regular physical activity and healthy eating may be less prioritized. Research suggests that satisfaction of basic needs is associated with greater capacity for behavior change and obesity management [24], whereas unsafe environments and community level crime are linked to reduced physical activity [16,25]. Thus, Maslow’s framework provides a conceptual lens through which low socioeconomic conditions may restrict health behaviors that protect against obesity.
The present study
Understanding the major health risk factors associated with obesity, it may be too costly to ignore the link between low SES, inactivity, and obesity. Previous literature has proven physical inactivity to be a significant mediator when assessing low SES variables and chronic health outcomes. For example, a study examining the relationship between neighborhood crime and Type 2 Diabetes found that over 60% of this relationship was mediated by physical inactivity [26]. In addition, physical inactivity was found to mediate the relationship between the built environment walkability and glycosylated hemoglobin [27]. As physical inactivity is a main contributor to obesity, and rates of physical activity are lowest in worse quality environments, the present study will incorporate physical inactivity as a mediator between hardship and obesity.
The first aim of the study is to investigate the relationship between hardship and obesity. It is hypothesized (H1) that hardship will be positively associated with obesity. The second aim of the study is to assess the mediating effect of physical inactivity on the relationship between hardship and obesity. For this aim, it is hypothesized (H2) that physical inactivity will be a significant mediator of this relationship. Both hypotheses will be assessed and interpreted utilizing Hayes’ PROCESS Macro.
Study Methods
Study Design and Data Source
This study utilized a cross sectional ecological design using secondary community level data from the Chicago Health Atlas, a publicly available database developed through collaboration between the Chicago Department of Public Health and the University of Illinois Chicago. The Atlas includes neighborhood level data for 75 Chicago community areas, reporting over 160 public health indicators related to the physical environment, morbidity, and clinical care. Previous research utilizing the Chicago Health Atlas data set found that lower-income communities, especially those with a history of injustices, had higher reported hardship index scores and higher rates of homicide [28]. Its strengths include rich local level data that allows for precise neighborhood comparisons and broad indicator coverage. However, limitations include inconsistent timeframes across indicators and restriction to variables available within the dataset, which may limit the examination of additional contextual health factors.
Hardship index
The Chicago Hardship Index, available through the Chicago Health Atlas, is a composite measure of low socioeconomic status designed to capture economic disparities across Chicago communities, particularly on the South and West sides. It includes six indicators: unemployment, educational attainment, per capita income, poverty, overcrowded housing, and age dependency. While prior research has primarily examined hardship in relation to homicide rates, the present study investigates its association with obesity in Chicagoland communities.
Participants
This study investigated hardship and obesity rates within Chicago communities (N = 75), with an estimated population of 2,746,388 [29]. To be included in the study, each community must have presented data from adults at least 18 years or older that established residency in Chicago. Data regarding childhood health indicators was excluded. All races, ethnicities, and genders were included in the mediation analysis. A majority of participants in Chicago communities that met criteria for obesity identified as Black (36.9%) and female (52.3%).
Procedure
After a thorough search of available public datasets, The Chicago Health Atlas was chosen. Data from the Chicago Health Atlas is gathered by the Population Health Analytics, Metrics and Evaluation (PHAME) center through The University of Illinois Chicago. PHAME collects data from multiple national and local surveys, including the CDC and Chicago and Illinois Community Health Needs Assessments. Data is then tagged based on zip code or community area. This dataset was chosen based on the associated strengths outlined above. After filtering for adult obesity rates, hardship index scores, physical inactivity rates, and demographic information, the data was downloaded as an Excel file. Each of the 75 community areas were listed, along with their associated scores. A screening process was completed for missing data. This Excel file was then uploaded into a statistical software for data analyses.
Measures
Demographics
Demographic information for adult obesity rates in Chicago communities were included. Demographic data was retrieved from the Chicago Health Atlas database, and includes race and gender. Each score is the percentage of adults who meet criteria for obesity. For example, the percentage of obese adults identifying as Hispanic or Latino was calculated as the number of Hispanic or Latino adults in the community divided by the number of Hispanic or Latino adults meeting criteria for obesity. This process was completed for females, males, Non-Hispanic Black, Non-Hispanic White, Hispanic or Latino, Asian or Pacific Islander, Mixed Race, and Native American individuals.
Hardship
The Hardship Index was developed to reflect economic hardship [30]. For the Chicago Health Atlas, scores were provided by the American Community Survey (ACS). The ACS replaced the long form version of the U.S. census, and is distributed to one in every 38 U.S. households per year. Hardship Index scores are composite scores that consist of items pertaining to unemployment, age dependency, education, per capita income, crowded housing, and poverty. Scores are evenly scaled, ranging from 0-100, and is similar to a rank-ordered list. Higher scores indicate greater hardship. The Hardship Index is highly correlated with other measures of economic hardship, including labor force statistics, and poor health outcomes.
Physical Inactivity
Physical inactivity rates were reported for each community. Physical inactivity scores represent the percent of adults in each community who reported no participation in any physical activities or exercises in the past month. These scores were calculated by dividing the estimated number of adults aged 18 years or older who met criteria for inactivity by the estimated total number of adults. These numbers were then weighted to represent the population from which the sample was drawn.
Obesity
Obesity rates were measured for each community. Scores for each community represent the estimated number of adults aged 18 years or older who report a height and weight that produces a BMI of 30 or greater, divided by the estimated number of adults, and is expressed as a percentage. These scores were then weighted to represent the population from which the sample was drawn.
Analysis
This study utilized a secondary analysis of the Chicago’s Health Atlas Database. All data were conducted utilizing the statistical software SPSS. Descriptive statistics for each study variable were calculated and included mean, standard deviation, and minimum/ maximum values. Statistical analyses included a bivariate correlation matrix for all variables of interest and a simple mediation analysis using Hayes’ PROCESS Macro to test for the mediation effect of physical inactivity on the relationship between hardship and obesity. For correlational purposes, race is presented as the percentage of residents in each community who self-report identifying as Black, and gender is presented as the percentage of residents in each community who self-report identifying as female. These two variables were included in the correlation matrix based on established literature that identifies Black women as the demographic with the highest rates of obesity. In this analysis, hardship was the independent variable, physical inactivity was the mediator, and obesity was the dependent variable. Bias corrected bootstrap 95% confidence intervals (5,000 samples) determined statistical significance for the mediating variable at an alpha level of .05. Specifically, confidence intervals that do not straddle zero were used to determine statistical significance [31].
Results
Table 1 represents demographic statistics for adult obesity rates in Chicago communities. Sample race/ethnicity includes, Non-Hispanic Black (36.9%), Non-Hispanic White (28%), Hispanic (26.5%), Asian or Pacific Islander (6.4%), Mixed Race (1.9%) and Native American (0.1%). A majority of the sample reported their gender as female (52.3%).
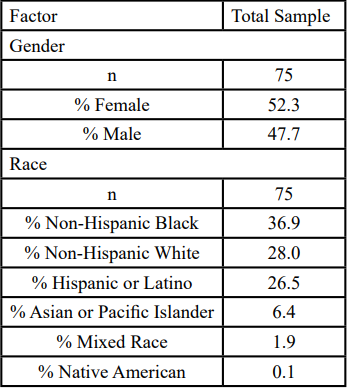
Table 1. Demographics for obesity rates in Chicago communities.
Skewness |-0.8 to 0.5| and kurtosis |-1.6 to 0.2| values suggested data, on average, were normally distributed. Table 2 represents descriptive statistics. On average, communities reported obesity levels of 36.2%, hardship index scores of 62.1, and physical inactivity levels of 27.7%.
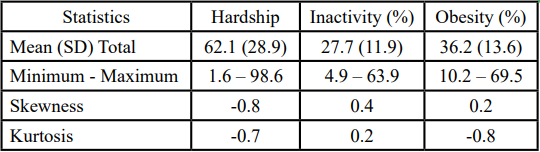
Table 2. Descriptive Statistics for Hardship Index Scores, Physical Inactivity Rates, and Obesity Rates in Chicago Communities.
Table 3 represents the bivariate correlation matrix for all variables of interest. Obesity was positively associated with inactivity (r=0.66, p<.001), hardship (r=0.64, p<.001), identifying as Black (r=0.54, p<0.01), and identifying as female (r=0.29, p<0.05). Hardship was significantly positively associated with inactivity (r=0.74, p<0.01), identifying as Black (r=0.52, p<0.01), and identifying as female (r=0.26, p<0.05). Inactivity was significantly positively associated with identifying as Black (r=0.38, p< 0.01) but not significantly associated with identifying female.
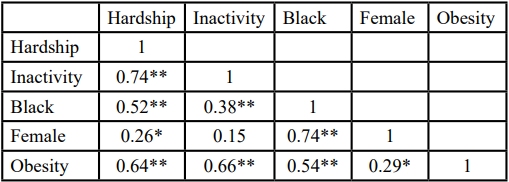
Table 3. Bivariate Correlation Matrix for Hardship, Physical Inactivity, Race, Gender, and Obesity
Hayes’ PROCESS Macro was used to complete a simple mediation analysis to assess whether physical inactivity explained the relationship between hardship and obesity. Overall, the results of this study found model to be statistically significant (F[2, 72]=33.68, p<.001). The r-square value revealed that 48.34% of the variance of obesity was explained in the mediation model. As depicted in Figure 1, hardship significantly predicted inactivity (a=0.31, SE=0.03, p<0.001) and produced a significant direct effect on obesity (c’=0.16, SE=0.60, p<0.009). Furthermore, inactivity was a significant predictor of obesity (b=0.46, SE=0.14, p<0.002).
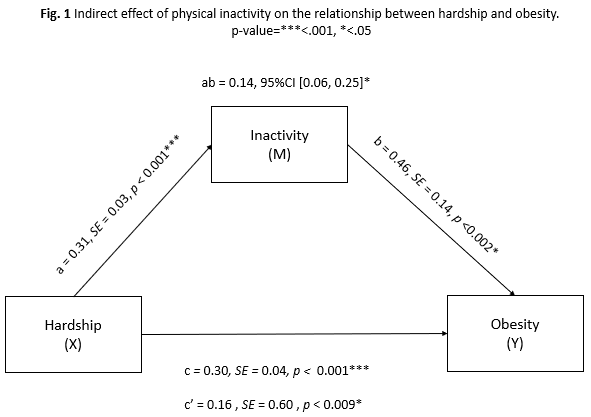
Figure 1: Indirect effect of physical inactivity on the relationship between hardship and object.
Hardship had a significant indirect effect on obesity as mediated by inactivity (ab=0.14, 95%CI [0.06, 0.25]). Taking inactivity into account, the total effect of hardship on obesity was statistically significant (c=0.30, SE=0.04, p<0.001). Accounting for the significant direct effect of hardship on obesity (c’=0.16, SE=0.60, p<0.009), these findings suggest that inactivity produces a partial mediation effect on the relationship between hardship and obesity.
Discussion
Evidence suggests that obesity and poverty rates in Chicago exceed national averages [1,32]. Guided by Maslow’s framework, this study examined whether physical inactivity mediates the relationship between hardship and obesity in Chicagoland adults. It was hypothesized that findings would reveal a positive association between hardship and obesity, but this relationship would be explained by physical inactivity. Results confirmed both study hypotheses, as hardship was found to be positively related to obesity, and this relationship was partially mediated by physical inactivity.
Findings align with prior research, demonstrating a positive association between socioeconomic hardship and obesity [5]. Consistent with Maslow’s framework, unmet basic needs related to housing, safety, and financial stability may restrict engagement in health promoting behaviors such as physical activity and healthy eating [23,24]. Physical inactivity was found to be a significant mediator between hardship and obesity, aligning with previous literature that confirms physical inactivity as a mediator between other low SES variables and chronic conditions [26,27]. Additionally, community level correlations reflected established racial and gender disparities, with higher obesity and hardship rates observed in areas with greater proportions of Black residents and women.
Despite findings, this study has several limitations. Implementing a correlation, cross-sectional design does not allow for causal conclusions to be made. Data was extracted from a public database, limiting the potential to investigate other social disparities and health outcomes that might have been of interest. For example, unmeasured variables such as food access, healthcare access, neighborhood safety, and chronic stress may also contribute to observed associations. All measures were self-reported, which may introduce bias. Data were drawn from different reporting periods across indicators, and the physical inactivity measure lacked specificity regarding duration or intensity of activity, potentially limiting precision in the mediation analysis.
Implications
Addressing obesity and its socioeconomic determinants should remain a public health priority in Chicago. Community gardens represent one feasible intervention, as participation has been associated with increased fruit and vegetable consumption and greater social engagement [33], potentially supporting health behaviors in low income communities. Although obesity is multifactorial, physical inactivity partially mediated the hardship– obesity relationship. Encouraging physical activity for children and adolescents is an important first step, as inactivity in adolescent years predicts obesity in adulthood [34]. Furthermore, expanding equitable access to initiatives such as bike share programs, including income based pricing models, may promote broader participation. However, structural and economic inequalities that influence neighborhood safety and access to resources must also be addressed to achieve sustainable health improvements.
Future Directions
As the inclusion of the Hardship Index is relatively unique, there is still a need to address health outcomes relating to hardship. Future research initiatives might benefit from utilizing the Hardship Index to examine the effects of low SES on other chronic health conditions such as diabetes, heart disease, and cancer. Furthermore, this study examined environmental influences of obesity. Research suggests, however, that both environmental and genetic factors contribute to obesity and related health outcomes. Genetically, certain individuals may be more at risk for developing obesity [35]. Given the limited research utilizing the Hardship Index, future studies could benefit from investigating the role hardship plays in exacerbating predisposed vulnerabilities to develop obesity.
Conclusions
The purpose of this study was the investigation of the mediating role of physical inactivity on the relationship between hardship and obesity rates in Chicago adults. Findings revealed that most individuals meeting requirements for obesity are Black females. Furthermore, physical inactivity was found to be a partial mediator to explain obesity for individuals living in low SES conditions. Physical activity and community garden interventions can be implemented to target health disparities and promote the attainment of motivational needs. Future studies should focus on utilizing the Hardship Index to investigate its moderating effect in relation to genetic vulnerabilities to develop obesity.
Competing interests:
All authors have no competing interests when completing this article.
References
Centers for Disease Control and Prevention. (2022). Adult Obesity Facts. Overweight and Obesity. View
Sarma, S., Sockalingam, S., & Dash, S. (2021). Obesity as a multisystem disease: Trends in obesity rates and obesity-related complications. Diabetes, Obesity and Metabolism, 23, 3-16. View
Centers for Disease Control and Prevention. (2013). Obesity and tobacco use prevention. Community Profile: Chicago Illinois. View
American Psychological Association. (2022). Socioeconomic status. American Psychological Association. View
Levine, J. A. (2011). Poverty and obesity in the U.S. Diabetes, 60(11), 2667-2668. View
Food security and nutrition assistance (2022). USDA ERS – Food Security and Nutritional Assistance. View
Drewnowski, A. (2012). The economics of food choice behavior: Why poverty and obesity are linked. Obesity Treatment and Prevention: New Directions, 73, 95-112. View
U.S. Census Bureau (2021). Poverty, All people in Chicago city, Illinois, 2021 American Community Survey 1-Year Estimates.
Centers for Disease Control and Prevention. (2022). How much physical activity do adults need? Physical Activity. View
Hallal, P.C., Andersen, L.B., Bull, F.C., Guthold, R., Haskell, W., & Ekelund, U. (2012). Global physical activity levels: Surveillance progress, pitfalls, and prospects. Lancet, 6736(12), 60646-60651. View
Sallis, R., Young, D. R., Tartof, S. Y., Sallis, J. F., Sall, J., Li, Q., Smith, G. N., & Cohen, D. A. (2021). Physical inactivity is associated with a higher risk for severe COVID-19 outcomes: A study in 48,440 adult patients. British Journal of Sports Medicine, 55(19), 1099-1105. View
Lee, I., Shiroma, E.J., Lobelo, F., Puska, P., Blair, S.N., & Katzmarzyk, P.T. (2012). Effect of physical inactivity on major non-communicable diseases worldwide: An analysis of burden of disease and life expectancy. Lancet, 6736(12), 61031-61039. View
Janssen, I., Boyce, W. F., Simpson, K., & Pickett, W. (2006). Influence of individual-and area-level measures of socioeconomic status on obesity, unhealthy eating, and physical inactivity in Canadian adolescent. The American Journal of Clinical Nutrition, 83(1), 139-145. View
Gray, C. L., Messer, L. C., Rappazzo, K. M., Jagai, J. S., Grabich, S. C., & Lobdell, D. T. (2018). The association between physical inactivity and obesity is modified by five domains of environmental quality in U.S. adults: A cross-sectional study. PLOS ONE, 13(8). View
Thorp, A. A., Owen, N. N., & Dunstan, D. W. (2011). Sedentary behaviors and subsequent health outcomes in adults: A systematic review of longitudinal studies, 1996-2011. American Journal of Preventative Medicine, 41, 207-215. View
Lotfata, A., Georganos, S., Kalogirou, S., & Helbuch, M. (2022). Ecological associations between obesity prevalence and neighborhood determinants using spatial machine learning in Chicago, Illinois, USA. International Journal of Geo Information, 11, 550. View
Crenshaw, K. (1989). Demarginalizing the intersection of race and sex: A Black feminist critique of antidiscrimination doctrine, feminist theory and antiracist politics. University of Chicago Legal Forum. View
Agyemang, P., & Powell-Wiley, T. (2014). Obesity and black women: Special considerations related to genesis and therapeutic approaches. Current Cardiovascular Risk Reports, 7(5), 378-386. View
Baltrus, P. T., Lynch, J. W., Everson-Rose, S., Raghunathan, T. E., & Kaplan, G. A. (2005). Race/Ethnicity, Life-Course Socioeconomic Position, and Body Weight Trajectories over 34 Years: The Alameda County Study. American Journal of Public Health, 95(9), 1595–1601. View
U.S. Census Bureau (2020). Current population survey, 1960 to 2020 annual social and economic supplement. View
Clarke, P., O’Malley, P. M., Johnston, L. D., & Schulenberg, J. E. (2009). Social disparities in BMI trajectories across adulthood by gender, race/ethnicity and lifetime socio-economic position: 1986-2004. International Journal of Epidemiology, 38(2), 499- 509. View
Maslow, A. H. (1943). A theory of human motivation. Psychological Review, 50(4), 370–396. View
Arcaya, M. C., Ellen, G. I., & Steil, J. (2024). Interventions at the neighborhood level could help reduce health inequalities: A critical review of the relationship between neighborhoods and health. Health Affairs. View
Van Lenthe, F. J., Jansen, T., & Kamphuis, C. B. M. (2015). Understanding socio-economic inequalities in food choice behavior: Can Maslow’s pyramid help? British Journal of Nutrition, 113(7), 1139-1147. View
Rees-Punia, E., Hathaway, E. D., & Gay, J. L. (2018). Crime, perceived safety, and physical activity: A meta-analysis. Preventative Medicine, 111, 307-313. View
Hanigan, M. K., Heisler, M., & Choi, H. J. (2020). Relationship between county-level crime and diabetes: Mediating effect of physical inactivity. Preventive Medicine Reports, 20. View
Carroll, S. J., Niyonsenga, T., Coffee, N. T., Taylor, A. W., & Daniel, M. (2017). Does physical activity mediate the associations between local-area descriptive norms, built environment walkability, and glycosylated hemoglobin? International Journal of Environmental Research and Public Health, 14(9), 953. View
Amdat, W. C. (2021). The Chicago hardship index: An introduction to urban inequity. Journal of Statistics and Data Science Education, 29(3), 328–336. View
U.S. Census Bureau. (2024). Chicago city, Illinois – Profile of general population and housing characteristics: 2024. View
Nathan, R. P., & Adams, C. (1976). Understanding central city hardship. Political Science Quarterly, 91(1). 47-62. View
Hayes, A. F. (2013). Introduction to mediation, moderation, and conditional process analysis. The Guilford Press. View
U.S. Census Bureau (2021). Poverty, All people in United States, 2021 American Community Survey 1-Year Estimates.
Litt, J. S., Soobader, M.-J., Turbin, M. S., Hale, J. W., Buchenau, M., & Marshall, J. A. (2011). The Influence of Social Involvement, Neighborhood Aesthetics, and Community Garden Participation on Fruit and Vegetable Consumption. American Journal of Public Health, 101(8), 1466–1473. View
Pietilainen, K. H., Kaprio, J., Borg, P., Pasqui, G., Yki-Jarvinen, H., Kujala, U. M., Rose, R. J., Westerterp, K. R., & Rissanen, A. (2008). Physical inactivity and obesity: A vicious circle. Obesity, 16(2), 409-414. View
Bouchard, C. (2021). Genetics of obesity: What we have learned over decades of research. Obesity, 29(5), 802–820. View