
- About the Journal
- Editorial Board
- Review Process
- Author Guidelines
- Article Processing Charges
- Special Issues
- Current Issue
- Past Issue
 Journal of CAM Research Progress
Journal of CAM Research Progress Volume 1 (2023), Article ID: JCRP-107
https://doi.org/10.33790/jcrp1100107Research Article
A New HPLC Method for Argatroban Intermediate and its Related Substance
Mengfei Wang1,2, Hongxiang Wang1,2, Mujun Zhang,1,2,4*, Chaolei Wang3, Tao Shi1,2, Yao Deng1,2, Shuang Sun1,2, Jiangpeng Kang1,2, and Yi Pan1,2,5
1Tianjin Institute of Pharmaceutical Research Tianjin 30000, China.
2Tianjin Taipu Pharmaceutical Tianjin 30000, China.
3Hunan Qianjin Xiangjiang Pharmaceutical Hunan 41200, China.
4Research Unit for Drug Metabolism, Chinese Academy of Medical Sciences, Tianjin 30000, China.
5State Key Laboratory of Drug Delivery and Pharmacokinetics, Tianjin Institute of Pharmaceutical Research, Tianjin 300301, People’s Republic of China.
Corresponding Author: Mujun Zhang, Research Unit for Drug Metabolism, Chinese Academy of Medical Sciences, Tianjin 30000, China.
Received date: 22nd November, 2022
Accepted date: 05th January, 2023
Published date: 07th January, 2023
Citation: Wang, M., Wang, H., Zhang, M., Wang, C., Shi, T., Deng, Y., Sun, S., Kang, J., & Pan, Y., (2023). A New HPLC Method for Argatroban Intermediate and its Related Substance. J CAM Research Progress, 2(1): 107.
Copyright: ©2022, This is an open-access article distributed under the terms of the Creative Commons Attribution License 4.0, which permits unrestricted use, distribution, and reproduction in any medium, provided the original author and source are credited. Creative Commons Attribution License, which permits unrestricted use, distribution, and reproduction in any medium, provided the original author and source are credited
Abstract
A simple and specific quantitative analysis method has been developed and validated for the determination of Argatroban Intermediate and its related substance. This method uses reversed-phase high performance liquid chromatography (RP-HPLC) to analyze the Argatroban Intermediate and its six related substance. Chromatographic conditions for RP-HPLC with UV detector were as follows: column, Agela Venusil MP, 250mm×4.6mm, 5μm; column temperature, 45°C; mobile phase, a 65: 35 (v/v) mixture of ammonium acetate buffer: methanol; flow rate, 1.0 mL/min. The detection wavelength was UV 272 nm. Under these conditions, excellent linearity was obtained (r2>0.9995) in the concentration range of 0.47~4.71μg/ml for Argatroban Intermediate, 0.30~5.04μg/ ml for impurity A, 0.12~4.93μg/ml for impurity B, 0.29~4.81μg/ ml for impurity C, 0.30~4.96μg/ml for impurity D,0.12~4.77μg/ ml for impurity E and 0.12~4.86μg/ml for impurity F, respectively. The LOQ was 0.5μg/ml for Argatroban Intermediate, 0.3μg/ml for impurity A, 0.125μg/ml for impurity B, 0.3μg/ml for impurity C,0.3μg/ml for impurity D, 0.125μg/ml for impurity E and 0.125μg/ ml for impurity F. The maximum R.S.D.(%) of the content of Argatroban Intermediate and its each impurity was 5.3% under the deliberate variations in method parameters.
Introduction
Argatroban is a synthetic, reversible and competitive thrombin inhibitor [1], and it directly and selectively inhibits the action of free and clot-associated thrombin [2-4]. The main features of this drug are that its antithrombin action can be rapidly onset, its anticoagulant action is rapidly reversible, and it can effectively inhibit thrombin without antibody formed. This drug does not require an initial dose adjustment in patients with renal impairment, and is hepatically metabolised [5]. These properties make argatroban an effective first-line therapy for HIT (Heparin-induced thrombocytopenia) [6-7], and it was also described in a recent meta-analysis as being superior to other parenteral drugs used for the management of HIT [8].
Argatroban was approved by the U.S. Food and Drug Administration (FDA) in 2000 for the prevention or treatment of thrombosis in patients with HIT. In 2002, it was approved for percutaneous coronary intervention in patients with or at risk for HIT, then NHRA in the UK approved argatroban for the treatment of thrombosis in patients with HIT Type II [9].
The object studied in this paper is one of the important intermediates for the synthesis of Argatroban APIs. There have been some studies on the synthetic preparation of this intermediate [10,11], but no analytical method has been published to accurately quantify this substance. This paper aims to develop and validate an HPLC method that can efficiently quantify Argatroban Intermediate and its impurities (Figure 1). We validated the method with parameters such as specificity, linearity, accuracy, precision, intermediate precision, and robustness.
Experimental
2.1. Chemicals and reagents
Methanol, acetonitrile and glacial acetic acid, all HPLC grade from Concord, formic acid from Guangfu and ammonium acetate from Merck, HPLC grade water from Watsons were used. The reference substance of Argatroban Intermediate and the related substances was obtained from Taipu Pharmaceutical Co., Ltd.
2.2 Chromatographic system and conditions
The HPLC system was a Separations module (Waters Technology, Milford, U.S.A) consisted of a Alliance 2695 pump, autosampler Alliance 2695, UV detector 2489 and column heater. Data were achieved and computed by the Empower Software. Wavelength was set at 272nm and the volume of each injection was 20μl. Chromatographic separation was achieved in 80 min at 45° C with a C18 column, Venusil MP, 250mm×4.6mm, 5μm (Agela Technology, Tianjin, China). Wash solvent of the syringe was methanol.
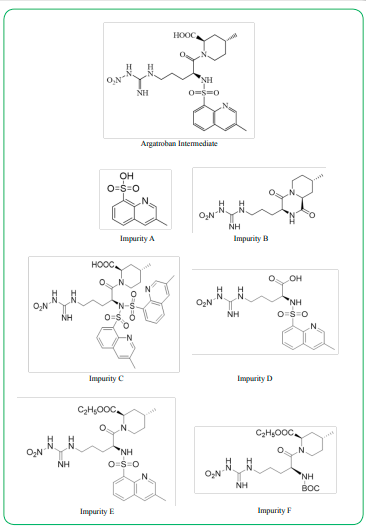
Figure 1: Chemical structure of Argatroban Intermediate and its six impurities
2.3 Mobile phase
The mobile phase consists of mobile phase A and mobile phase B. Mobile phase A is ammonium acetate buffer, prepared by dissolving 5g of anhydrous ammonium acetate in 1000 ml of water, adding 50ml of glacial acetic and mixing. Mobile phase A was filtered through nylon membrances( 47nm, 0.22μm; Pall Company, USA) and sonicated during 15min. Mobile phase B is methanol. Use mobile phase A: mobile phase B: 35:65 as the sample solvent.
The pump delivered the mobile phase at 1.0 ml/ min with a gradient profile as shown in the table below.

Table
2.4 Standard preparation
The Impurity A stock solution was prepared by taking an appropriate amount of Impurity A, dissolving it with acetonitrile and quantitatively diluting it with sample solvent into a solution containing about 0.5 mg of Impurity A per 1 ml.
The Impurity B, Impurity C, Impurity D, Impurity E and Impurity F stock solution were prepared as the same preparation method of Impurity A stock solution.
A mixture of standard solution was prepared by weighting Argatroban Intermediate and its related substances to yield a final concentration of 100% of Argatroban Intermediate and 3.0% of each Impurity A, Impurity B, Impurity C, Impurity D, Impurity E and Impurity F with respect to the sample concentration of 0.5mg/ml.
2.5 Sample preparation
The Argatroban Intermediate stock solution was prepared by taking an appropriate amount of Argatroban Intermediate, dissolving it with sample solvent and quantitatively diluting it into a solution containing about 1.5 mg of Argatroban Intermediate per 1 ml.
Validation of HPLC Method
3.1 Specificity
Specificity is the ability to assess unequivocally the analyte in the presence of components which may be expected to be present. The specificity of this method was validated by the retention time and resolution of the chromatographic peaks of each substance.
3.2 System Suitability
System suitability test (SST) is a test to determine the suitability and effectiveness of chromatographic system prior to use. The performance of any chromatographic system may continuously change during their regular use, which can affect the reliability of the analytical results [12]. It is an essential parameter to ensure the quality of the method for correct measurements.
Resolution and theoretical plate number are important HPLC performance indicators. Resolution is used to ensure that closely eluting compounds are resolved from each other as they pass through the column in the given condition. Resolution of > 2 between the peak of interest and the closest potential interfering peak is desirable. And the theoretical plate number is a measure of column efficiency.
3.3 Limits of detection and quantitation
LOD (Limit of Detection) and LOQ (Limit of Quantification) are parameters employ to explain the smallest concentration of an analyte that can be reliably measured by an analytical procedure. The LOQ is lowest concentration that quantitatively measured suitably with accuracy and precision while the LOD is the concentration that can be detected [13]. Typically, the LOQ is observed to be in the area where the signal-to-noise ratio is greater than 10, and the LOD is observed to be in the area where the signal-to-noise ratio is greater than 3. We injected multiple concentrations of each reference substance and measured the signal-to-noise ratio level at each concentration. Finally, the detection limit and quantification limit are obtained. Finally, in order to verify the estimated value, 6 samples with the limit of quantification and 1 sample with the limit of detection were prepared and injected into the system.
3.4 Linearity
Linearity is the method’s ability to obtain test results, which are directly proportional to the concentration of the analyte in the sample. Linearity is determined by injecting a series of standards of stock solution, at a minimum of five different concentrations in the range of 50–150% of the expected working range [14]. Validation for linearity requires the preparation and analysis of a set of several independently prepared solutions. The intercept, plot slope, sum of squares of residuals, response factor and correlation coefficient provide the desired information on linearity. Considering the possibility of using this analytical procedure in studies, five solutions from LOQ to 5.0 μg/ml were prepared by diluting stock solutions in sample solvent, in order to study system linearity response. Each solution was injected once.
3.5 Precision
Precision of a method is the degree of agreement among individual test results when the procedure is applied repeatedly to multiple samplings. Precision includes repeatability, intermediate precision, and reproducibility [15]. Repeatability is a measure of the within laboratory uncertainty, it evaluates the performance of the method conditions and estimates the amount of variability that can be expected for a single analyst and HPLC system for a given sample [16]. Intermediate precision is used to assess changes that occur when measurements are made using different conditions, such as different analysts, instruments, or dates. And reproducibility is used to assess interlaboratory variability [17].
3.6 Accuracy
Accuracy is the agreement between the test results obtained by the proposed method and the true value. It expresses the correctness of the method [18]. Accuracy should be assessed at least 3 concentration levels covering the specified range, with triplicate formulations prepared at each level. As ICH Q2(R1), the accuracy for assay of a drug substance can be studied from 80% to 120% of the test concentration. The accuracy solution at 80%, 100% and 120% can be prepared in triplicate, analyzed as test method and recovery shall be calculated.
3.7 Robustness
The robustness of an analytical method is the measure of its capacity to remain unaffected by small, but deliberate variations in method parameters, and provides an indication of its reliability during normal usage [19]. The robustness of a chromatographic method may be evaluated by variations in parameters such as percent organic content in the mobile phase or gradient ramp, pH of the mobile phase, buffer concentration, temperature, and injection volume.
3.8 Solution stability
For the sample solutions and standard solutions specified in the normal method, they should be stable within a certain period of time. Acceptable stability is not more than 2% change in standard and sample response.
Result
4.1 Method Development
Try to use chromatographic columns with the packing of C18, C8 and phenyl. The chromatographic column with the packing of C18 has better separation performance for Argatroban Intermediate and its impurities. Therefore, the chromatographic column with the packing of C18 is selected for analysis. In addition, different chromatographic column temperatures were used for analysis. When the column temperature was 45 ° C, each substance had a good response, so it was determined to use 45 ° C as the column temperature.
4.2 Specificity
All individual compounds are injected separately at the desired concentration (Impurity A-15μg/mL, Impurity B-15μg/mL, Impurity C-15μg/mL, Impurity D-15μg/mL, Impurity E-15μg/mL, Impurity F-15μg/mL, Argatroban Intermediate-0.5mg/mL). Additionally, impurities were added to the Argatroban Intermediate as a mixed solution (sample solution - 0.5 mg/mL) and injected into the HPLC system. The diluents did not interfere with any individual impurity (the unknown and known impurities). Table 1 shows the results of individual injection of each substance. The chromatograms are given in Figure 2. The minimum resolution between chromatographic peaks in the mixed solution is greater than 2.0.
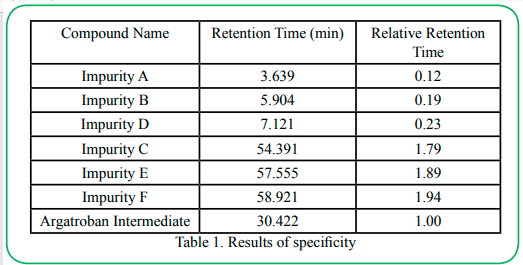
Table 1. Results of specificity

Figure 2. The chromatogram of solution where the impurities were added in Argatroban Intermediate
4.3 System Suitability
As the same operation in 4.2, the mixed solution where the impurities were added in Sample (Argatroban Intermediate) was injected into HPLC system. System suitability parameters were evaluated and the values are shown in Table 2. These values are within given range mentioned in ICH guidelines. All the parameters were proved that the chromatographic system used was suitable for the analysis of Argatroban Intermediate.
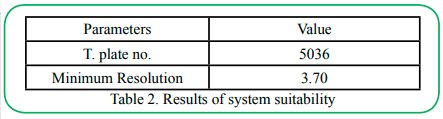
Table 2. Results of system suitability
4.4 LOD and LOQ
The LOD and LOQ values of Impurity A, B, C, D, E, F and Argatroban Intermediate are shown in Table 3, It indicates the high sensitivity of the proposed method.
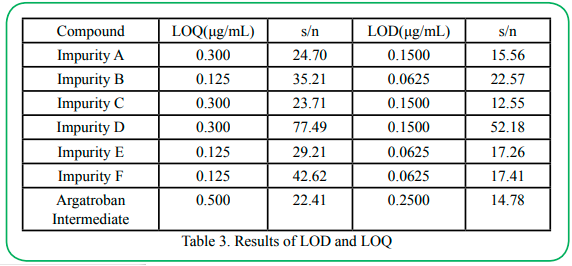
Table 3. Results of LOD and LOQ
4.5 Linearity and range
The calibration curves of Impurity A, B, C, D, E, F and Argatroban Intermediate are plotted using peak area against concentration. the concentration ranges of 0.47~4.71μg/ml for Argatroban Intermediate, 0.30~5.04μg/ml for Impurity A, 0.12~4.93μg/ml for Impurity B, 0.29~4.81μg/ml for Impurity C and 0.30~4.96μg/ml for Impurity D, 0.12~4.77μg/ml for Impurity E, 0.12~4.86μg/ml for Impurity F, respectively. The results are listed in Table 4.

Table 4. Results of linearity and range
4.6 Accuracy
The sample solution was spiked with impurity stock solutions at three concentration levels corresponding to 50%, 100% and 150% of impurities at a specification level by multiple replicate preparations (n=3) of each concentration. The percent recovery was calculated and listed in Table 5.

Table 5. Results of accuracy
4.7 Precision
Using the 100% spiked solution (as in accuracy determination) by multiple replicate preparations (n=6) of the same sample. The intermediate precision of the method was checked by repeating studies on different days, different analytical instruments and different analysts. The results of precision and intermediate precision are listed in Table 6 and Table 7.
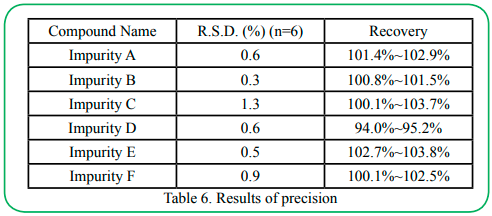
Table 6. Results of precision
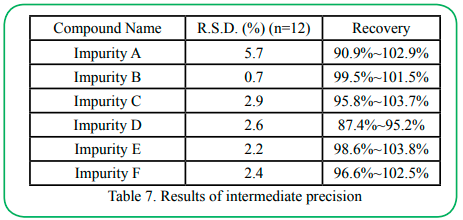
Table 7. Results of intermediate precision
4.8 Robustness
The robustness test was carried out under the initial chromatographic conditions, column flow rate ± 0.1ml/min (Impurity C is ±0.05ml/min), column temperature ± 1°C, and mobile phase ratio ± 1%, the results had proven that the method is robust in Table 8~10.
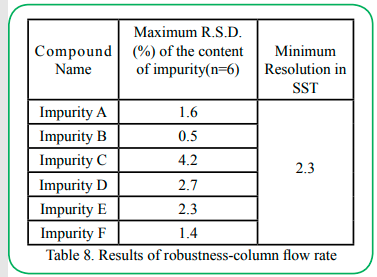
Table 8. Results of robustness-column flow rate
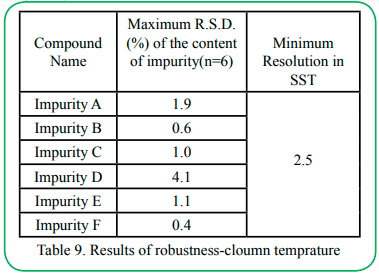
Table 9. Results of robustness-cloumn temprature

Table 10. Results of robustness-mobile phase ratio
4.9 Solution Stability
Standard and sample solutions were tested for stability at multiple time points. The stability of Argatroban Intermediate and impurities in solution was determined by calculating the R.S.D. (%) of the main peak area at each time point. Using R.S.D. (%) to express the 21-hour content test results, Argatroban Intermediate showed 1.0%, Impurity A was 0.2%, Impurity B was 0.3%, Impurity C was 0.4%, Impurity D was 0.3%, Impurity E was 0.3%, Impurity F was 0.2%. The results showed that the solution was stable for 21 hours at ambient temperature.
Conclusion
The first HPLC method for the separation and simultaneous quantitation of the six impurities of Argatroban Intermediate is reported. The proposed method was developed and adequately validated with respect to critical parameters for pharmaceutical quality control such as specificity, linearity, accuracy and precision.
Competing interest:
The author declares that they have no competing interests.
References
Swan, S.K. & Hursting, M. J. (2000). The pharmacokinetics and pharmacodynamics of Argatroban: effects of age, gender, and hepatic or renal dysfunction. Pharmacotherapy; 20(3):318–29.View
Investigator's Brochure for Argatroban (2001). Houston, Tex: Texas Biotechnology Corp.
Tanaka, Kenichi, A. et al. (2004). The effects of Argatroban on thrombin generation and hemostatic activation in vitro. Anesthesia & Analgesia (Hagerstown, MD, United States) , 99(5), 1283-1289.View
Walenga JM. (2002). An overview of the direct thrombin inhibitor Argatroban. Pathophysiol Haemost Thromb; 32 (suppl3) 9-14.View
Levine, R. L. et al. (2006). Argatroban therapy in heparin-induced thrombocytopenia with hepatic dysfunction. Chest, 129(5), 1167–1175.View
Alatri Adriano et al. (2012). Results of a consensus meeting on the use of Argatroban in patients with heparin-induced thrombocytopenia requiring antithrombotic therapy - a European perspective. Thromb Research, 129(4), 426–433.View
Cuker, Adam et al. (2018). American Society of Hematology 2018 guidelines for management of venous thromboembolism: heparin-induced thrombocytopenia. Blood Adv; 2(22):3360–3392.View
Colarossi, Giorgia et al. (2021). Superior outcomes with Argatroban for heparin-induced thrombocytopenia: a Bayesian network meta-analysis. Int J Clin Pharmacol;43(4):825–38.View
"UK launch for Mitsubishi's blood thinner Exembol". 3 July 2012.View
Chong, Yongjiang et al. Preparation of Argatroban Intermediate by continuous flow synthesis method. [P]. CN113563417. 2021-10-29.
Fu, Lin et al. Process for preparation of Argatroban Intermediate. [P]. CN104558103. 2015-04-29.
Osman Tiryaki et al. (2009). Setting System Suitability Parameters for Performance Optimization of GC-NPD Detection for Pesticide Residue Analysis.G.U. Journal of Science 22(3): 149-155View
Mohamad Taleuzzaman et al. Limit of Blank (LOB), Limit of Detection (LOD), and Limit of Quantification (LOQ). Organic and Medicinal Chemistry international journal. Short Communication Volume 7 Issue 5 - August 2018.View
Rao, Tentu Nageswara. (2018). Validation of Analytical Methods. Calibration and Validation of Analytical Methods. Chapter 7.View
Soumia Belouafa et al. (2017). Statistical tools and approaches to validate analytical methods: methodology and practical examples. Int. J. Metrol. Qual. Eng. 8, 9.View
Kallner, Anders et al. (2020). Measurement repeatability profiles of eight frequently requested measurands in clinical chemistry determined by duplicate measurements of patient samples. Scandinavian Journal of Clinical and Laboratory Investigation, 80(3), 202-209.View
Joachim Ermer et al. (2005). Precision from drug stability studies Investigation of reliable repeatability and intermediate precision of HPLC assay procedures. Journal of Pharmaceutical and Biomedical Analysis 38, 653–663.View
Patil, Sunila T et al. (2017). A short review on method validation. Journal of Pharmaceutical and BioSciences, 5(4), 30-37.View
Isabela da Costa César & Gerson Antônio Pianetti. (2009). Robustness evaluation of the chromatographic method for the quantitation of lumefantrine using Youden’s test. Brazilian Journal of Pharmaceutical Sciences vol. 45, n. 2, abr./jun.View