
- About the Journal
- Editorial Board
- Review Process
- Author Guidelines
- Article Processing Charges
- Special Issues
- Current Issue
- Past Issue
 Journal of Mental Health and Social Behaviour
Journal of Mental Health and Social Behaviour Volume 3 (2020), Article ID: JMHSB-131
https://doi.org/10.33790/jmhsb1100131Research Article
The Impact of Productive Engagement on BMI Classification in Middle Age and Later Life
Angela L. Curl1* &James Hinterlong2,MSW, PhD
1*Department of Family Science & Social Work, Miami University (Ohio), 210 E. Spring Street, Oxford, OH 45056-3493, United States.
2Professor and Visiting Scholar, College of Management, Tunghai University, Taichung, Taiwan.
Corresponding Author Details: Angela L. Curl, Department of Family Science & Social Work, Miami University (Ohio), 210 E. Spring Street, Oxford, OH 45056-3493, United States. E-mail: curla@miamioh.edu
Received date: 26th December, 2020
Accepted date: 05th February, 2021
Published date: 10th February, 2021
Citation: Curl, A.L. & Hinterlong, J. (2021). The Impact of Productive Engagement on BMI Classification in Middle Age and Later Life. J Ment Health Soc Behav 3(1):131.
Copyright:©2021, This is an open-access article distributed under the terms of the Creative Commons Attribution License 4.0, which permits unrestricted use, distribution, and reproduction in any medium, provided the original author and source are credited.Creative Commons Attribution License, which permits unrestricted use, distribution, and reproduction in any medium, provided the original author and source are credited
Abstract
Purpose: This study examines productive engagement among middle-age and older adults as a predictor of body mass classification over time, from a role theory perspective.]
Methods: Longitudinal data (2010-2018) from the Health and Retirement Survey were analyzed using multinomial logistic regressions, with separate analyses for two age groups: middle-age (age 50-64; n=8,005) and older adults (age 65 and over; n=9,123).
Results: For the middle-age sample, working more hours increased odds of being overweight, and more time spent caring for parents increased the odds of being obese. For older adults, informal volunteering decreased the odds of being underweight. For the most part, being in the obese category was predicted by health (more chronic conditions, worse self-rated health, less frequent vigorous exercise, and non-smoker status), and sociodemographic factors (lower earnings, lower education, Black race, and younger age) for both younger and older samples.
Implications: The findings reinforce the benefits of public support for workplace wellness initiatives that promote healthy eating and exercise behaviors. Further, public funding could be used to support programs that promote informal volunteering for older adults could reduce the risks associated with being underweight, thus advancing social aims while promoting public health.
Keywords: BMI, Volunteering, Paid employment, Parental caregiving, Longitudinal
Introduction
This study examines productive engagement as a predictor of body mass index over time. A growing research literature demonstrates productive engagement as a predictor of overall health and psychological well-being. Productive engagement – defined as paid or unpaid activities that produce goods and services [1]- is increasingly becoming an area of interest for researchers. Little attention, however, has been paid to how productive engagement can affect weight in older adults. This is notable given the many health risks associated with being underweight and obese. Examining the relationship between productive engagement and body mass index among middle-age and older adults links these areas of research, and expands our understanding of the mechanism related to healthy aging. We begin with an overview of the literature about body mass index, how it changes over time, and how it is associated with relative health risks. We then describe the literature on productive engagement, our theoretical framework, and previous empirical findings about the relationship between productive engagement and body weight.
Body Mass Index of Adults
Body mass index (BMI) is a widely used measurement of physical health. BMI is calculated as weight in kilograms divided by height in meters squared. The World Health Organization [2] uses the following BMI cut-off points: below 18.50 (underweight), 18.50 – 24.99 (normal range), 25.00 – 29.99 (overweight), and 30.00 and over (obese). These cut-offs are used as a screening tool for various health risks, including heart problems and mortality.
Flegal et al. [3] found that body mass index gradually increases for both men and women throughout most of their adult life, peaking between ages 50-59 [3]. After the age of 60 mean body weight and BMI then begin to decrease. Most studies, which have evaluated obesity related complications, however, have not been conducted on older adults. These studies instead sample primarily middleaged people. Because obese persons have a higher mortality rate at younger ages, the cross-sectional studies may have been affected by survival bias [4].
Overweight and Obesity:
Over two-thirds of middle-aged and older men are overweight or obese (77.8% for men age 40-59 vs. 78.4% for men age 60 and over). For women, 66.3% of those age 40-59 are overweight or obese, compared to 68.6% of those age 60 and over [5]. When considering obesity classifications only, over one third of men and women are obese (BMI of 30 or more; 34.3% of men and 38.2% of women age 40-59; 37.1% of men and 33.6% of women age 60 and over).
Being obese is associated with greater risk of avoidable hospitalizations for older adults [6], metabolic diseases [7], arthritis [8], sleep apnea [9], urinary incontinence[10], visual impairment due to cataracts [11], some cancers [12], and impaired balance control [13].
There is a linear relationship between BMIs over 25 and increased risk of ADL disability, compared to those who are normal weight [14]. However, in a meta-analysis of the relationship between being overweight/obesity and mortality, Flegal and colleagues [15] found that being overweight reduced the risk of mortality for adults age 65+ compared to normal weight older adults. Being overweight can also mitigate the risks associated with frailty (e.g., falls, illness-related weight loss, muscle and bone mass loss).
Underweight: While much public attention is devoted to obesity, being underweight is also linked to poorer health outcomes for older adults. For older adults, having a BMI of less than 18.5 is associated with increased risk of ADL disability [14], mortality [14], and avoidable hospitalizations [6], compared to those who are normal weight. Older adults who experienced a faster rate of BMI decline were at greater risk of chronic health conditions and functional disability [16].
Productive Engagement among Older Adults
Advances in healthcare and increased knowledge regarding healthy lifestyles have contributed to higher numbers of people living longer. According to the United States Census Bureau, in 2018 there were over fifty-four million people in the United States age 65 and older [17]. Longer, healthier lives mean many more people today are remaining active far beyond the age of retirement.
This extension of healthy longevity has drawn increased attention to how individuals sustain and change their involvement in various activities. Of particular interest are productive activities, which generate goods or services, whether for pay or on a voluntary basis. Research on productive engagement in later life reveals that older adults are commonly involved in many different types of activities that can be considered productive, including employment, formal volunteering, informal volunteering, and parental caregiving [18]. These activities can be viewed as occurring within specific roles, as they are defined by a set of responsibilities, the performance of which requires the individual to invest time, energy, and often resources. Role theory [19], which is widely used to examine human behavior, offers insight into role expectations of older adults and the impact that productive engagement has on weight. Prior studies have explored the connection between productive activities and various indicators of health, functioning and well-being in later life.
Productive engagement involves varying levels of physical and intellectual activity and exposes the individual to increased social activity. Its connection to health and other measures of well being among older adults has been repeatedly demonstrated and shown to be bidirectional [20]. Work to date reveals there are complex interrelationships among the antecedents and outcomes of engagement. Yet there is evidence to suggest engagement in productive roles has a significant, independent effect on health and functioning in later life [21]. Fried and her colleagues [22] offer a social model of health promotion that reflects this view. They propose the mixture of social, physical and cognitive factors evident in productive activities creates a set of pathways within the observed relationship with health and functioning. Collectively, these factors are also likely to help explain why engagement is related to weight.
Individuals hold many roles simultaneously at any given point in the life course. These activities often occur in an organizational context (i.e., workplace, volunteer program, church) and involve other people as collaborators or beneficiaries (i.e., caregiving, informal volunteering). Thus, formal and informal expectations shape how and when the individual performs the activities. These demands on the individual and their resources become more complex when multiple activities are undertaken concurrently – a common situation for many older persons [18]. Concurrently fulfilling the responsibilities of these roles places additional demands on the individual, and role theory indicates that this impacts well-being. Engagement in multiple productive roles has been shown to be associated with more positive physical, psychological and emotional health [21,23]. More recently, Jabs and Devine [24] show that engagement in a greater number of productive activities (employment, volunteering, attending meetings, and caregiving) is associated with a reduction of inflammation in a sample of adults age 57-85, with the strongest benefit from volunteering. This finding underscores evidence of physiological pathways linking productive engagement and health.
Performance of single or multiple concurrent productive roles requires time. Time pressures are known to affect both dietary habits and physical activity [25,26]. Again, limited research has examined the impact of time use in productive activities on weight among older adults. Mercan et al. [27] found that older workers who worked more than 60 hours per week were more likely to gain weight than older workers who worked fewer hours. This finding is consistent with that of other studies showing a decrease in healthy behaviors or an increase in risky health behaviors linked to body weight among those intensely involved in productive roles like caregiving [28]. Caregiving has been shown to impact weight-related behaviors like diet [29]. Schulz and colleagues [30] also found that caregivers experienced no change in weight upon death of their care recipient spouse while non-caregiving widows and widowers exhibited significant weight loss. Their findings reveal a direct and dynamic relationship among engagement, health behaviors and weight.
Related research suggests how some types of productive activity may indirectly affect an individual’s weight. For example, by generating financial resources that can be used to access food, paid employment might allow an individual maintain healthy weight or facilitate their becoming overweight. Enhanced feelings of self-efficacy through effective performance of role responsibilities and management of related stress such as those involved with caregiving may also lead individuals to engage in more positive health behaviors [31].
Productive Engagement and Body Mass Index
Maintenance of healthy weight in later life is influenced by health behaviors, physical activity [32], genetic [33] and socio-economic factors [34]. In turn, weight, especially unhealthy degrees of being under or overweight, can selectively affect the performance of Activities of Daily Living (ADLs) and Instrumental Activities of Daily Living (IADLs) [35], as well as engagement in social activities [36]. The empirical evidence linking weight and productive engagement specifically is very limited, and largely considers how weight constrains engagement [37,38]. More attention has been given to the weight-engagement relationship among younger persons. For example, Schreier et al. [39] found that teenagers who volunteered had a lower body mass index post-intervention than those in the control group. Given the growing importance placed on promoting healthy weight in an aging population, the current study aims to address this gap. We use Role Theory to conceptually frame the potential association between late life productive engagement and weight.
The current study does not attempt to tease out the mechanisms that connect weight and productive engagement in later life. Instead, we explore how that relationship varies in relation to differences in engagement and across categories of weight as measured by body mass index. Using role theory and the role enhancement perspective as a framework, as well as previous studies that suggest that productive engagement enhances health and well-being of older adults, we hypothesized that more hours of engagement in each of four productive roles would be associated with reduced odds of being in unhealthy weight categories for middle age and older adults.
Methodology
Participants
This study utilized data from Health and Retirement Survey [40], with the cleaned and streamlined version of the HRS data created and maintained by the RAND Corporation [41]. This is a nationallyrepresentative study of community-based adults over the age of 50, with over samples of Blacks, Hispanics and Florida residents [42]. HRS is an on-going biannual study funded by the National Institute on Aging (NIA U01AG009740) and conducted by the University of Michigan.
For this study, data from 2010-2018 were used. In the HRS (post- 1998), many measures were asked the same way at every wave and were coded consistently (e.g., age, sex, race, height, weight). The initial sample size was 42,053 individuals. The following sample selection criteria were used for this study:
• Age 50 and older in 2010 (excluded 21,011).
• White or Black race (“Other races” were eliminated due to the small percentage of respondents among these groups; excluded 1,705).
• Respond to 2010 (baseline) interview, with data not provided by proxy respondent (excluded 1,247).
• Sample selection weight at baseline greater than zero (excluded 310).
• Complete baseline data for race, education, sex, income and marital status (excluded 302).
• At least one wave of complete data for other study variables (excluded 350).
These restrictions resulted in a final sample size of 17,128 respondents.
Measures
Body Mass Index: (BMI; dependent variable). This index was a measure of body fat based on weight and height (kg/m2). For the analyses, BMI was measured as a categorical variable. WHO [2] guidelines were used to categorize respondents into one of four groups at each wave: underweight, normal weight, overweight, or obese. Respondents were divided into two subsamples based on age: the younger sample (age 50-64 in 2010) and the older sample (those age 65 and over in 2010) and analyses were conducted separately for the two age cohorts.
Productive Engagement: Productive engagement was measured in terms of number of hours of participation in four roles: paid employment (number of hours working at main and secondary job), formal volunteering (volunteer work during the past 12 months for religious, educational, health-related or other charitable organizations), informal volunteering (help provided during the past 12 months to friends, neighbors, or relatives who did not live with the respondent and did not pay for the help), and parental caregiving (assistance with basic personal care or errands provided to parents or parents-in-law within the past two years).
As HRS asked about number of hours of formal and informal volunteering as categorical variables starting in 2004, a decision was made to apply the same analytic strategy for hours of employment and parental caregiving as well. Hours of paid employment and hours of parental caregiving were both recoded into quintiles; for employment, responses were coded so that 0=none, 1=1-24, 2=25- 39, 3=40-45, and 4=46 or more hours per week. For parental caregiving, responses were coded as 0=none, 1=1-199 hours, 2=200- 399 hours, 3=400-599 hours, and 4=600 or more hours during the past two years. Both formal and informal volunteering were coded as 0=none, 1=less than 100, 2=about 100, 3=101-199, 4=about 200, and 5=more than 200 hours.
Control variables: Demographic variables included age, race, sex, education, marital status, and income. Age was measured as years old by the end of each interview. Age was centered by subtracting the minimum age for the subsample (i.e., age 50 for the younger group and age 65 for the older group) to facilitate intercept interpretation and model convergence. Race was coded 0 for Whites/Caucasians and coded 1 for Blacks/African Americans (all other races were excluded as part of the sample selection criteria). Sex was coded 0 for males and 1 for females. Education was measured as the years completed when the respondent first entered the HRS study (0 to 17=17 or more), and was centered around the subsample mean. For marital status, respondents were coded 1 if they were married or partnered, or 0 if they were never married, separated, divorced, widowed, or had an unknown marital status). For income, the RAND variable for total individual annual earnings was used; A nominal constant value ($100) was added to all values to eliminate zeros, then the natural log transformation was used to address problems with skew and kurotos is, and then this value was centered around the subsample baseline mean for the multilevel analyses.
Health control variables included measures of physical health, health behaviors, and mental health. Self-rated health was asked as a single item that was reverse coded so that higher numbers indicated better health (0=poor to 4=excellent). Respondents were asked if a doctor had ever diagnosed them with any of the following chronic conditions: “1) high blood pressure or hypertension; 2) diabetes or high blood sugar; 3) cancer or a malignant tumor of any kind except skin cancer; 4) chronic lung disease except asthma such as chronic bronchitis or emphysema; 5) heart attack, coronary heart disease, angina, congestive heart failure, or other heart problems; 6) stroke or transient ischemic attack (TIA); 7) emotional, nervous, or psychiatric problems; and 8) arthritis or rheumatism” [41 p. 614]; responses were then summed into a count of conditions (range 0-8). For health behaviors, respondents were asked if they were current smokers (1=yes, 0=no), if they currently ever drink alcohol (1=yes, 0=no), and how regularly they engaged in vigorous exercise (0=never, to 4=every day). Depressive symptomatology was measured using the 8-item dichotomous version of the Center for Epidemiologic Studies – Depression (CES-D) Scale [43]. Respondents were asked if they had experienced any of the following symptoms in the previous week (yes/no): felt depressed, felt lonely, was happy (reverse coded), felt that everything was an effort, sleep was restless, felt sad, enjoyed life (reverse coded) and could not get going; results were summed into a scale (range 0-8; higher numbers indicate more depressive symptoms).
Data Analysis Strategy
As data were longitudinal and multinomial, analyses used Hierarchical Generalized Linear Modeling (HGLM) with HLM 6.08 software and full penalized quasi-likelihood estimation. This approach is ideal because it “allows level-1 predictors to have different associations with the probabilities of different types of [outcome]” [44 p. 326]. It also takes into account clustering of observations within individuals, computes corrected standard errors, and retains cases for any wave with complete data.
The level-1 model represents the effects of time and time-varying predictors on body weight categories: the four types of productive activity, health control variables, and sociodemographic factors. For time-varying covariates, HLM averages the effect of the relationship between time-varying covariates and the outcome across all waves [46]. The level-2 model represents the moderation effects of timeinvariant predictors (i.e., race, sex, age, education, income, marital status) on the relationship between level-1 predictors and body weight.
The analyses were conducted as a series of nested models. Model 1 consisted of baseline body weight (i.e., intercept), linear rate of change in body weight category (i.e., time slope), and hours of engagement in four roles – all entered as fixed effects. Model 2 added age, race, sex, education, income, and marital status as predictors of the intercept; vigorous exercise, self-rated health, chronic conditions, smoking, alcohol drinking, and depressive symptomatology were entered as time-varying, fixed effects on body weight. Below is a simplified version of the mixed equation for Model 2:
η BMI = γ00(Intercept) + γ10(Time) + γ20(Productive Roles) + γ30(Control Variables) + u,
where η represents the log-odds of falling into each of the body weight categories relative to that of falling into the reference category. The intercept (γ00) represents the expected log-odds of being in particular weight category (relative to the reference group) at baseline for a person at the minimum age for their subgroup (age 50 or age 65), who is White, male, has average education and income, is not married at baseline, who does not engage in frequent vigorous exercise, has no chronic conditions, is a non-smoker, does not drink alcohol, who self-rates health as “poor,” who has no depressive symptoms, and who does not work, volunteer, or engage in parental care giving. This model has three random effects (u) – one for each body weight category (relative to the reference group).
All analyses are weighted using person-level weights from 2010 (baseline) to account for HRS’ complex sampling. These weights “are structured to match the … ACS from 2004-2016 forward, which includes living, non-institutionalized respondents” [41 p. 86].
Missing Data & Attrition
ISR and the RAND Corporation have implemented strategies to reduce or impute missing data [41]. First, the HRS study design often used a series of follow-up questions to fill-in a value when the respondent answered “don’t know” or otherwise refused to answer (e.g., in 2010 respondents who said that they engaged in formal volunteering were asked how many hours they volunteered; those who said “don’t know” or refused to answer were asked if the number of hours was less than 100 hours, about 100 hours, or more than 100 hours. If they said it was more than 100 hours, they were asked if it was less than, about equal to, or more than 200 hours). RAND also used information from the HRS cover sheet, tracker files, and other variables (e.g., question about prostate exams to assign sex) to fill in missing data about marital status, sex, race, etc. Second, HRS utilized a complex skip pattern for some variables, like smoking; starting in 2004 HRS only asked respondents about their smoking if they had reported being a smoker for any of the previous waves; all respondents who had missing data for the smoking question in waves 7 and beyond because of this skip pattern were recoded as 0 (nonsmoker) by RAND. For chronic conditions, if a respondent had ever reported having a condition (e.g., diabetes), that person is always coded as having that condition (but they can dispute that information in the future). Our sample selection criteria further eliminated those with missing data for age (as well as those who were younger than 50; step 1), race (as well as those who were Hispanic and/or were “Other Race” category in the HRS public use data; step 2), as well as waves where respondents did not participate in the survey.
After these strategies were employed, we had less than 1% of missing data for any of the study variables. Therefore, we employed listwise deletion to remove 350 respondents (less than 1%) who did not have data for all study variables for a minimum of one wave since this method is unlikely to bias results when the proportion of subjects with missing data is small and the sample size is large [46].
The 210 respondents who were eliminated from the younger sample due to missing data at baseline were slightly more likely to be female, non-smoking, and their mean age, education, income, chronic conditions, and self-rated health was lower than for those with complete data; there were no statistically significant differences for race, marital status, drinking, vigorous exercise, or depressive symptomatology at baseline. For the older sample, the 140 respondents who were eliminated due to missing data were more likely to be female, not married, smoking, have fewer years of education, less frequent vigorous exercise, lower self-rated health, and more depressive symptoms than those with no missing data at baseline.
Respondents with missing data were eliminated on a per-wave basis (sample selection criteria step 6), as HLM does not require respondents to provide data for every wave in order to be included in the sample [44]. There was less attrition evidenced in the younger sample than the older sample. Data for four or five waves were provided by 6,223 (77.7%) respondents in the younger sample, compared to 5,534 (60.7%) for the older sample. Independent samples t-tests were used to compare baseline body mass index for those who provided data for all five waves (“completers”) with those who were missing for one or more waves, by sample. There was no difference in the mean BMI for the younger sample, but for the older subsample, the group of completers had a higher BMI at baseline than noncompleters (M=28.36 and M=27.21, respectively; p<.01).
Results
Table 1 presents unweighted and weighted descriptive statistics for study variables at baseline, for the younger and older samples. For the younger sample, the majority of respondents were White, female, and married, with a mean BMI of 29.57 (SD=6.55, range=7.0-83.0). For the older sample, most respondents were White, female, and married or partnered, with a mean BMI of 27.65 (SD=5.59, range=8.9-92.8). On average, both younger and older samples engaged in one or more productive roles (M=1.83 and M=1.04, respectively), and the most common productive activity for both age cohorts was informal volunteering. The younger sample was more likely than the older sample to engage in each of the productive roles.

Table 1. Descriptive Statistics at Baseline
Table. 2 presents the results of the weighted HGLM analyses for the younger sample. For this group, working more hours per week decreased the risk of being underweight but increased the odds of being overweight (Model 1), relative to being normal weight. After controlling for demographic and health variables (Model 2), more hours of paid employment and parental caregiving were both significant predictors of being classified as overweight, and more parental caregiving was associated with higher risk of being obese.
Each additional year of age at baseline decreased the risk of being obese by 6%, while the odds of being obese decreased by 5% per year, relative to normal weight. The random intercepts for the BMI categories were statistically significant for Model 1, suggesting that there was unexplained variance between individuals at baseline. Inclusion of sociodemographic and health control variables in Model 2 explained this variance for the underweight category, but not for the overweight and obese categories.
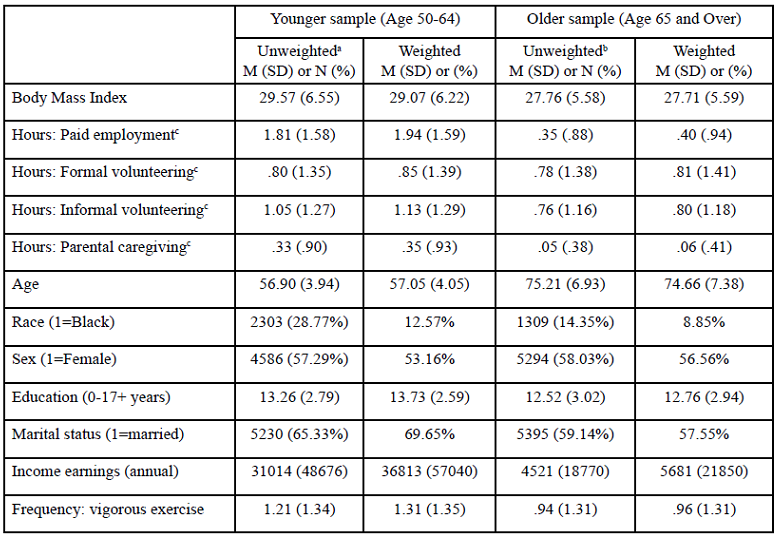
Table 2. Multinomial Logistic Regression Odds Ratios Predicting BMI Weight Category Over Time in a Sample of 50-64 Year Olds (N= 8,005)
Table. 3 presents the results of the weighted HGLM analyses for the older sample. The odds ratios represent the risk of being in each weight category relative to being overweight weight (the healthiest weight category for older adults). In Model 1, prior to entering the control variables, more hours of paid employment reduced the odds of being normal weight, and more hours of informal volunteering decreased the odds of being underweight or normal weight.
After controlling for demographic and health variables (Model 2, Table 3), more hours of informal volunteering reduced the odds of being in the underweight category (OR=.83), related to being in the overweight category. For the older sample, paid employment, parental caregiving and formal volunteering were not statistically significant predictors of BMI weight category. Older age increased the odds of being overweight by 8% but reduced the odds of being obese by 8%.
The odds of being underweight increased by 18% per year and of being normal weight by 8%, and while reducing the risk of being obese by 7% per year, relative to the overweight category. Similar to results for the younger sample, in the older adults sample the random intercepts for the BMI categories were statistically significant for Model 1, which was explained by sociodemographic and health control variables (see Model 2, Table 3) for the underweight category, but not the other BMI categories.
In post hoc analyses, a variable was created for the sum of productive activities (0-4 types of activities), and added as a time varying covariate in Model 2. Results indicated that the number of types of activities was not a significant predictor of body weight category for the middle-age sample. For the older adult sample, the sum of productive activities was statistically significant (OR=.81, p < .05) for the odds of being in the underweight category, but not for the normal or obese weight categories.

Table 3. Multinomial Logistic Regression Odds Ratios Predicting BMI Weight Category Over Time in a Sample Aged 65 and Over (N=9,123)
Discussion
In general, our results were contrary to the primary hypothesis that productive engagement would have a beneficial impact on body weight. Rather, for the middle-age sample more hours of paid employment was associated with an increased risk of being overweight, and more hours of parental caregiving was associated with an elevated risk of obesity. However, for the older sample, more hours of informal volunteering was associated with lower risk of being underweight.
Overall, productive activity was a more consistent predictor of BMI classification for middle-aged adults than for older adults. Since the younger sample is more likely to be engaged in paid employment than the older sample (62.8% vs. 17.6%, respectively) and they work more hours per week on average, this age cohort is more likely to be juggling work and other productive activities; the middle-age cohort was more likely to be engaged in each of the four productive roles than the older adult group. Engagement in multiple productive roles could reduce available time for meal preparation and consumption, resulting in eating food of poor nutritional quality. This idea is supported by findings that Baby Boomers engaged in informal caregiving were more likely to report less healthy eating behaviors (i.e., consumption of soda and fast-food) than non-caregivers [47].
According to the U.S. Bureau of Labor Statistics, labor force participation rates for adults age 55 and over have been increasing since the mid-1990s and are expected to continue to rise until at least 2024 [48], making the relationship between employment and unhealthy weight a point of caution in public health. Corporate wellness programs may be able to address this need by offering encouraging high intensity workplace behavioral weight loss programs as well as support and incentives 49],50].
We found that more hours of informal volunteering decreased the risk of being underweight for older adults. This is noteworthy since being underweight is a health status of particular concern for older adults [14,51]. The social aspect of volunteering, which often involves food, may explain the reduction in risk of being underweight. Informal volunteering may also increase access to food through shared meals, payment (in food) as thanks for assistance, etc., as well as providing more opportunities for others to note food insecurity. The health benefit of volunteering for older adults is consistent with previous research [24,52].
Previous research suggests that formal productive roles (e.g., employment, formal volunteering) places performance demands on individuals and provides intrinsic benefits, such as status, resources, and gratification [53]. Other research found that performance in meaningful roles promotes a sense of self efficacy that has been linked to several important health outcomes and behaviors in later life [31,54]. Further, much productive engagement activities involve a physical activity component, and even light intensity movement can reduce body fatness. Productive engagement has also been linked with better mental health [55], and in turn, mental health predicts other health behaviors such as eating patterns and exercise. Future research should explicitly examine the relationship between volunteering and both eating patterns and exercise, with an eye toward determining whether facilitating and incentivizing volunteer activity may have additional salutary public health benefits.
Strengths and Limitations
Our study has a number of strengths worth noting. First, our study used nationally representative data from the Health and Retirement Study. Second, use of eight years (2010-2018) of longitudinal data enables the examination of changes in body weight categories over time in response to changes in engagement in productive activities. Third, our measure of productive engagement included four potential roles that individuals could engage in: working, formal volunteering, informal volunteering, and parental caregiving. Fourth, we used multilevel modeling of repeated measures, which does not require individuals to provide data for all waves, so attrition is reduced and generalizability is increased. This modeling also permitted differential examination of the relationship between the intensity of engagement for each role, and separate BMI weight categories.
One limitation of our study is the difficulty in concluding cause and effect given the design of the HRS. We used categorical variables to capture (broadly) the amount of engagement in four types of productive activity as the main independent variables and BMI weight classification as the dependent variable. Yet, as in many previous studies on engagement which rely on survey data, we cannot assert these are causally related. Extant research shows that being underweight is associated with frailty [51], which is defined as difficulty with activities of daily living. Therefore, an individual who is considered frail might be less likely to be engaged in productive roles, while healthier individuals may be more likely to undertake and sustain involvement in a greater number of productive roles [21]. Analysis of baseline differences between study participants who provided data for all five waves versus those who were missing data for one or more waves, found significant differences (sex, educational level, health status, and BMI) between those with complete data and those with missing data, which could have potentially biased our findings. In addition, our categorical approach for measurement of BMI may not be sensitive to change over time. For example, someone who had been classified as obese and took on multiple productive roles may have had lost a significant amount of weight, yet they may have remained in the obese category.
While we examined the impact of productive engagement on body mass index classification, our study did not study the mechanisms or characteristics of roles that might affect the health benefits of engagement. For example, most productive activities involve relating with others, and perhaps it is the social interactions that explain the health benefits of volunteering for older adults. Additionally, the current study did not consider qualitative aspects of engagement, such as the individual’s perceptions of the activity (e.g., high vs. low demand) or reason for engagement (e.g., financial need, desire to help others, boredom). These aspects of role quality may moderate the health benefits of volunteering, for example, as Everard [56] found for the benefits of social activities. Further research should explore whether the role quality, intensity, salience and rationale affect its relation to weight.
Conclusions
This study provides important information for researchers and clinicians regarding the impact that productive engagement has on BMI. Findings from this study generally do not show a positive relationship between activity and weight, but nonetheless add to the previous research and further our knowledge about living actively during middle age and older adulthood. New questions also emerge. For example, what factors account for the overall pattern of results for the middle-age adults showing that greater investments of time in productive activities are related to unhealthy weight? Almost half (47.5%) of the older adults in this sample engaged in informal volunteering, which had a protective effect against being underweight. From a public health perspective, could promoting this type of volunteering among older adults reduce health risks associated with being underweight? The findings suggest that public funding of programs such as Experience Corps, which promotes older adult volunteerism, can help to advance key social aims while helping to promote a key public health priority in our aging society. Furthermore, well-designed, high intensity workplace-based weight loss programs may help middle-aged workers who are juggling multiple roles and competing time demands.
Conflict of interests:
The authors have no conflicts of interest to declare regarding the present manuscript.
References
Gonzales, E., & Morrow-Howell, N. (2009). Productive engagement in aging-friendly communities: A natural intersection. Generations, 33(2), 5158.View
World Health Organization. (2020, April). Obesity and overweight. Retrieved from https://www.who.int/news-room/ fact-sheets/detail/obesity-and-overweightView
Flegal, K.M., Carroll, M.D., Ogden, C.L., & Johnson, C. (2002). Prevalence and trends in obesity among US adults, 1999-2000. JAMA, 288, 1723-1727. doi:10.1001/jama.288.14.1723View
Fogelholm, M., Kujala, U., Kaprio, J., & Sarna, S. (2000). Predictors of weight change in middle-aged and old men. Obesity Research, 8(5), 367-373. doi:10.1038/oby.2000.44.View
Flegal, K.M., Carroll, M.D., Ogden, C.L., & Curtin, L.R. (2010). Prevalence and trends in obesity among US adults, 1999-2008. JAMA, 303(3), 235-241. doi:10.1001/jama.2009.2014View
Schriver, J. M. (2011). Human behavior and the social environment: Shifting paradigms in essential knowledge for social work practice. New York City: Pearson.View
Goodpaster, B., Krishnaswami, S., Harris, T., Katsiaras, A., Kritchevsky, S.B., Simonsick, E.M., Nevitt, M., Holvoet, P., & Newman, A.B. (2005). Obesity, regional body fat distribution, and the metabolic syndrome in older men and women. Archives of Internal Medicine, 165(7), 777-783. doi:10.1001/ archinte.165.7.777View
Hootman, J.M., Helmick, C.G., Hannan, C.J., & Pan, L. (2011). Prevalence of obesity among adults with arthritis – United States, 2003-2009. Morbidity and Mortality Weekly Report, 60, 509-513. Retrieved from www.cdc.gov/mmwr/preview/ mmwrhtml/mm6016a4.htmView
Li, C., Ford, E.S., Zhao, G., Croft, J. B., Balluz, L.S., & Mokdad, A.H. (2010). Prevalence of self-reported clinically diagnosed sleep apnea according to obesity status in men and women: National Health and Nutrition Examination Survey, 2005-2006. Preventive Medicine, 51(1), 18-23. doi:10.1016/j.ypmed.2010.03.016View
Richter, H.E., Kenton, K., Huang, L., Nygaard, I., Kraus, S., Whitcomb, E., Chai, T.C., Lemack, G., Sirls, L., Dandreo, K.J., & Stoddard, A. (2010). The impact of obesity on urinary incontinence symptoms, severity, urodynamic characteristics and quality of life. Journal of Urology, 183, 622-628. doi:10.1016/j.juro.2009.09.083View
Hiller, R., Podgor, M., Sperduto, R., Nowroozi, L., Wilson, P.W., D’Agostino, R.B., & Colton, T.A. (1998). A longitudinal study of body mass index and lens opacities: The Framingham Studies. Ophthalmology, 105, 1244-1250. doi:10.1016/S0161- 6420(98)97029-4View
National Cancer Institute. (2012). Obesity and cancer risk (Fact Sheet). Retrieved from www.cancer.gov/cancertopics/factsheet/ Risk/obesityView
Dutil, M., Handrigan, G. A., Corbeil, P., Cantin, V., Simoneau, M., Teasdale, N., & Hue, O. (2013). The impact of obesity on balance control in community-dwelling older women. Age, 35, 883-890. doi:10.1007/s11357-012-9386-xView
Al Snih, S., Ottenbacher, K.J., Markides, K.S., Kuo, Y.-F., Eschbach, K., & Goodwin, J.S. (2007). The effect of obesity on disability vs mortality in older Americans. Archives of Internal Medicine, 167, 774-780. doi:10.1001/archinte.167.8.774View
Flegal, K.M., Kit, B.K., Orpana, H., & Graubard, B.I. (2013). Association of all-cause mortality with overweight and obesity using standard body mass index categories: A systematic review and meta-analysis. JAMA, 309, 71-82. doi:10.1001/ jama.2012.113905View
Kahng, S.K., Dunkle, R.E., & Jackson, J. S. (2004). The relationship between the trajectory of body mass index and health trajectory among older adults: Multilevel modeling analyses. Research on Aging, 26, 31-61. doi:10.1177/0164027503258734View
United States Census Bureau. (2020). Population 65 years and over in the United States. Retrieved from https:// data.census.gov/cedsci/table?q=population%20age%20 65&tid=ACSST1Y2019.S0103View
Hinterlong, J. (2008). Productive engagement among older Americans: Prevalence, patterns, and implications for public policy. Journal of Aging & Social Policy, 20(2), 1-24. doi:10.1080/0895942080197749View
Merton, R.K., & Nisbet, R. (1971). Contemporary social problems (3rd ed.). New York, NY: Harcourt, Brace, & Jovanovich.View
Thoits, P., & Hewitt, L.N. (2001). Volunteer work and wellbeing. Journal of Health and Social Behavior, 42, 115-131. doi:10.2307/3090173View
Hinterlong, J.E., Morrow-Howell, N., & Rozario, P.A. (2007). Productive engagement and late life physical and mental health: Findings from a nationally representative panel study. Research on Aging, 29, 348-370. doi:10.1177/0164027507300806View
Fried, L.P., Carlson, M.C., Freedman, M., Frick, K.D., Glass, T.A., Hill, J., McGill, S., Rebok, G.W., Seeman, T., Tielsch, J., Wasik, B.A., & Zeger, S. (2004). A social model for health promotion for an aging population: Initial evidence on the experience corps model. Journal of Urban Health 81(1): 64-78. doi:10.1093/jurban/jth094View
Hao, Y. (2008). Productive activities and psychological wellbeing among older adults. Journal of Gerontology: Social Sciences, 63, S64-S72. doi:10.1093/geronb/63.2.S64View
Kim, S., & Ferraro, K.F. (2013). Do productive activities reduce inflammation in later life? Multiple roles, frequency of activities, and c-reactive protein. The Gerontologist (advanced access). doi:10.1093/geront/gnt090View
Jabs, J., & Devine, C.M. (2006). Time scarcity and food choices: An overview. Appetite, 47, 196-204. doi:10.1016/j. appet.2006.02.014View
Welch, N., McNaughton, S.A., Hunter, W., Hume, C., & Crawford, D. (2008). Is the perception of time pressure a barrier to healthy eating and physical activity among women? Public Health Nutrition, 12, 888-895. doi:10.1017/ S1368980008003066View
Mercan, M.A. (2013). A research note on the relationship between long working hours and weight gain for older workers in the United States. Research on Aging (online). doi:10.1177/0164027513510324View
Gallant, M.P., & Connell, C.M. (1997). Predictors of decreased self-care among spouse caregivers of older adults with dementing illnesses. Journal of Aging and Health, 9(3), 373- 395. doi:10.1177/089826439700900306View
Burton, L.C., Zdaniuk, B., Schulz, R., Jackson, S., & Hirsch, C. (2003). Transitions in spousal caregiving. The Gerontologist, 43, 230–241. doi:10.1093/geront/43.2.230View
Schulz, R., Beach, S.R., Lind, B., Martire, L.M., Zdaniuk, B., Hirsch, C., Jackson, S., & Burton, L. (2001). Involvement in caregiving and adjustment to death of a spouse: Findings from the Caregiver Health Effects Study. JAMA, 285, 3123-3129. doi:10.1001/jama.285.24.3123View
Rabinowitz, Y.G., Mausbach, B.T., Thompson, L.W., & Gallagher-Thompson, D. (2007). The relationship between self-efficacy and cumulative health risk associated with health behavior patterns in female caregivers of elderly relatives with Alzheimer's dementia. Journal of Aging and Health, 19(6), 946- 964. doi:10.1177/0898264307308559View
Villareal, D.T., Chode, S., Parimi, N., Sinacore, D.R., Hilton, T., Armamento-Villareal, R., Napoli, N., Qualls, C., & Shah, K. (2011). Weight loss, exercise, or both and physical function in obese older adults. New England Journal of Medicine, 364(13), 1218-1229. doi:10.1056/NEJMoa1008234View
Segal, N.L., Feng, R., McGuire, S.A., Allison, D.B., & Miller, S. (2009). Genetic and environmental contributions to body mass index: Comparative analysis of monozygotic twins, dizygotic twins and same-age unrelated siblings. International Journal of Obesity, 33(1), 37-41. doi:10.1038/ijo.2008.228View
Robert, S.A., & Reither, E.N. (2004). A multilevel analysis of race, community disadvantage, and body mass index among adults in the US. Social Science & Medicine, 59, 2421-2434. doi:10.1016/j.socscimed.2004.03.034View
Larrieu, S., Pérès, K., Letenneur, L., Berr, C., Dartigues, J.F., Ritchie, K., Février, B., Alpérovitch, A., & Barberger-Gateau, P. (2004). Relationship between body mass index and different domains of disability in older persons: The 3C study. International Journal of Obesity, 28, 1555–1560. doi:10.1038/sj.ijo.0802755View
Zettel-Watson, L., & Britton, M. (2008). The impact of obesity on the social participation of older adults. Journal of General Psychology, 135(4), 409-423. doi:10.3200/GENP.135.4.409-424View
Gates, D.M., Succop, P., Brehm, B.J., Gillespie, G.L., & Sommers, B.D. (2008). Obesity and presenteeism: The impact of body mass index on workplace productivity. Journal of Occupational and Environmental Medicine, 50, 39-45. doi:10.1097/JOM.0b013e31815d8db2View
Goetzel, R.Z., Gibson, T.B., Short, M.E., Chu, B.-C., Waddell, J., Bowen, J., Lemon, S.C., Fernandez, I.D., Ozminkowski, R.J., Wilson, M.G., & DeJoy, D.M. (2010). A multi-worksite analysis of the relationships among body mass index, medical utilization and worker productivity. Journal of Occupational and Environmental Medicine, 52(Suppl 1), S52–S58. doi:10.1097/ JOM.0b013e3181c95b84View
Schreier, H.M.C., Schonert-Reichl, K.A., & Chen, E. (2013). Effect of volunteering on risk factors for cardiovascular disease in adolescents: A randomized controlled trial. JAMA: Pediatrics, 167, 327-332. doi:10.1001/jamapediatrics.2013.1100View
Health and Retirement Study. (2019, December). Health and Retirement Study, 1992-2018 (early v1 for 2018), public use dataset [Computer file]. Produced and distributed by the University of Michigan with funding from the National Institute on Aging (grant number NIA U01AG009740).
Bugliari, D., Carroll, J., Hayden, O., Hayes, J., Hurd, M., Karabatakis, A., Main, R., Marks, J., McCullough, C., Meijer, E., Moldoff, M., Pantoja, P., Rohwedder, S., & St. Clair, P. (2020, April). RAND HRS longitudinal file 2016 (V2) documentation. Available at https://www.rand.org/content/dam/rand/www/ external/labor/aging/dataprod/randhrs1992_2016v2.pdfView
Juster, F.T., & Suzman, R. (1995). An overview of the Health and Retirement Study. Journal of Human Resources, 30(Suppl.), S7-S56. doi:10.2307/146277View
Radloff, L.S. (1977). The CES-D Scale: A self-report depression scale for research in the general population. Applied Psychological Measurement, 1, 385-401. doi:10.1177/014662167700100306View
Raudenbush, S.W., & Bryk, A.S. (2002). Hierarchical linear models: Applications and data analysis methods (2nd ed.). Thousand Oaks, CA: Sage.View
McCoach, D.B., & Kaniskan, B. (2010). Using time-varying covariates in multilevel growth models. Frontiers in Psychology (online). doi:10.3389/fpsyg.2010.00017View
Cohen, J., Cohen, P., West, S.G., & Aiken, L.S. (2003). Applied multiple regression/correlation analysis for the behavioral sciences (3rd ed.). Mahwah, NJ: Lawrence Erlbaum Associates.View
Hoffman, G.J., Lee, J., & Mendez-Luck, C.A. (2012). Health behaviors among baby boomer informal caregivers. The Gerontologist, 52(2), 219-230. doi:10.1093/geront/gns003View
Toossi, M., & Torpey, E. (2017, May). Older workers: Labor force trends and career options. Career Outlook, U.S. Bureau of Labor Statistics. Available at https://www.bls.gov/ careeroutlook/2017/article/older-workers.htmView
Marakami, J.M., Bennett, B.L., Rand-Giovannetti, D., Stefano, E.C., & Latner, J.D. (2020). Enhancing employee wellness: Translating an effective community behavioral weight-loss treatment to the worksite. Nutrition and Health, 26(3), 215–223. https://doi.org/10.1177/0260106020926834View
Wilson, E.R., Kyle, T.K., Nadglowski, J.F., & Stanford, F.C. (2017). Obesity coverage gap: Consumers perceive low coverage for obesity treatments even when workplace wellness programs target BMI. Obesity, 25(2), 370-377. doi:10.1002/ oby.21746View
Jenkins, K.R., Kabeto, M.U., Fultz, N.H., & Langa, K.M. (2007). Informal caregiving and body mass index among older adults. Journal of Gerontological Nursing, 33(4), 42–51.View
Jung, Y., Gruenewald, T.L., Seeman, T.E., & Sarkisian, C. A. (2010). Productive activities and development of frailty in older adults. Journal of Gerontology: Social Sciences, 65B(2), 256- 261. doi:10.1093/geronb/gbp105View
Moen, P., Robison, J., & Dempster-McClain, D. (1995). Caregiving and women’s well-being: A life course approach. Journal of Health and Social Behavior, 36, 259–273. doi:10.2307/2137342View
Adelmann, P.K. (1994). Multiple roles and psychological well-being in a national sample of older adults. Journal of Gerontology Social Sciences, 49, S277–285. doi:10.1093/ geronj/49.6.S277View
Choi, A.L., Grandjean, P., Sun, G., & Zhang, Y. (2013). Developmental Fluoride Neurotoxicity: Choi et al. Respond. Environ Health Perspect, 121(3): a70. doi: 10.1289/ ehp.1206192RView
Everard, K.M. (1999). The relationship between reasons for activity and older adult well-being. Journal of Applied Gerontology, 18, 325–340. doi:10.1177/073346489901800304View