
- About the Journal
- Editorial Board
- Review Process
- Author Guidelines
- Article Processing Charges
- Special Issues
- Current Issue
- Past Issue
 Journal of Rehabilitation Practices and Research
Journal of Rehabilitation Practices and Research Volume 3 (2022), Article ID: JRPR-131
https://doi.org/10.33790/jrpr1100131Research Article
Measurement of Body Composition in the Dehydrated State
Michael T.C. Liang, Ph.D.1*, Thomas W. Allen, D.O.2, Mark E. McKeigue, D.O.3
1Professor, Department of Kinesiology and Health Promotion, College of Science, California State Polytechnic University – Pomona, 3801 West Temple Avenue, Pomona, California 91768, USA.
2 Oklahoma State University, College of Osteopathic Medicine, Department of Internal Medicine, Tulsa, Oklahoma, USA.
3Midwestern University College of Osteopathic Medicine, Department of Family Medicine, Downers Grove, Illinois, USA.
Corresponding Author Details: Michael T.C. Liang, Ph.D., Professor, Department of Kinesiology and Health Promotion, College of Science, California State Polytechnic University – Pomona, 3801 West Temple Avenue, Pomona, California 91768, United States. E-mail: mtcliang@cpp.edu
Received date: 11th December, 2021
Accepted date: 06th January, 2022
Published date: 08th January, 2022
Citation: Liang, M.T.C., Allen, T.W., & McKeigue, M.E. (2022). Measurement of Body Composition in the Dehydrated State. J Rehab Pract Res, 3(1):131.
Copyright: ©2022, This is an open-access article distributed under the terms of the Creative Commons Attribution License 4.0, which permits unrestricted use, distribution, and reproduction in any medium, provided the original author and source are credited.Creative Commons Attribution License, which permits unrestricted use, distribution, and reproduction in any medium, provided the original author and source are credited
Abstract
The purpose of the study is to examine the effect of exercise-induced dehydration on body composition using three indirect methods: bioelectrical impedance analysis (BIA), skinfold thickness (SF), and underwater weighing (UWW).
Method: Thirty healthy, physically active subjects with normal weight (22 males) participated as study subjects. After baseline body composition measurements using the above three methods were obtained, the subjects began to dehydrate by exercise until an average of 1.5% body weight loss was accomplished. Within 10 minutes post-exercise, the subjects’ body composition measurements using the same measurement methods were repeated.
Results: There was a significant (p<0.05) difference between the three methods for determining fat free mass (FFM), fat mass (FM), and percent body fat (%BF). The %BF and FM measurements using the BIA method were significantly (p<0.05) affected by exercise-induced dehydration, but not the UWW or the SF method. Compared to the UWW method before dehydration, the SF method significantly (p<0.05) under-estimated FM, %BF, and over-estimated FFM, whereas the BIA method significantly (p<0.05) over-estimated FM and % BF, and under-estimated FFM. These observations also occur after exercise-induced dehydration. Comparing genders, the BIA method produced higher %BF and FM values in the female subjects than in the male subjects both before and after dehydration.
Conclusion: We concluded that exercise-induced dehydration of 1.5% weight loss significantly (p<0.05) limits the usefulness of the BIA method for determining human body composition in physically active and normal weight adults, whereas dehydration induced an insignificant effect on the SF or UWW method.
Keywords: Percent body fat, Fat mass, Fat free mass, Underwater weighing, Skinfold thickness, Bioelectrical impedance analysis, Dehydration, Aerobic exercise
Introduction
A question often asked is “Why measure body composition?” Among the multiple reasons are to aid athletic trainers, physiotherapists, exercise personal trainers and physicians in sports medicine to develop and optimize exercise training programs, and also to develop specific dietary interventions for their athletes and non-athletes. A body composition measurement can provide insight into the design of exercise training programs in order to improve the ratio of lean tissue to fat tissue which is significantly related to physical performance and fitness, health, and disease [1,2,3]. It has been reported that fat mass is associated with low bone mass and that lean mass was a positive determinant of bone size [4]. There are a variety of methods for determining body composition including arthrometry, body density, total body water by isotope dilution, whole body measurement of radioactive potassium, neutron activation analysis for total body nitrogen and calcium, computed tomography, dual-energy X-ray absorptiometry (DEXA), total electrical conductivity, nuclear magnetic resonance imaging (MRI), bioelectrical impedance analysis (BIA), ultrasound, infrared interactance, and skinfold thickness (SF) [3,5,7,9,12]. In human study, most of the available methods are designed for the indirect measurement of body fat content. The skin fold thickness (SF) and BIA are frequently used in the clinical setting [7,8,9,13], whereas the densitometry method using the underwater weighing (UWW) procedure, the air displacement (Bod Pod), whole body DEXA, and ultrasound are most often used in research and are considered laboratory methods [12].
The indirect measurement of body fat content is subject to considerable error associated with biological (i.e., dehydration, menstruation), instrument and technical (i.e., technician’s skill, electrode placement) variations [3,14,15]. The BIA method is based on the principle that the electrical conductivity of lean tissue is far greater than that of fat because of a much higher water and electrolyte content in lean tissue [3,7,8]. Consequently, fluid loss and increased blood flow to the skin during and after exercise, changes in skin electrolyte concentrations, and alteration in skin temperature may affect bioelectrical conductivity [3,7,10,16,17]. The BIA method measures body electrical impedance of the water compartment to the flow of either single or multi-frequency currents. With the BIA method body composition estimation from the impedance requires a number of assumptions and a specific regression equation for estimating FFM, FM, and percent body fat (%BF) for the target population [3,7,8,16]. The reported test-retest reliability (R) for the BIA method was very high, between 0.993 and 0.995 [7]. Also, Liao et al. [3] compared the BIA method to that of DEXA technology and observed high corrections between BIA and DEXA in estimating total lean mass, FM and %BF (r = 0.909-0.986, 0.757- 0.964, and 0.837-0.936, respectively). In the study by Pearman et al. [18] on BIA compared to the UWW method between pre- and post-dehydration, the BIA measurement showed a mean loss of 2.1% fat, while the UWW measurement showed only a loss of 0.9% fat after 45 minutes exercise-induced dehydration. The authors also reported that BIA obtained percent body fat was 3.5% higher than the UWW obtained percent body fat [18]. Thompson et al. [6] compared the BIA method to the UWW method for assessing body composition under three conditions: hydration, dehydration and control, and found that there was a statistically significant decrease in percent body fat (%BF) with the BIA determined in the dehydrated state as compared to the control and hydrated conditions.
The SF method is a widely recognized technique for assessing body adiposity and fat free mass by assuming that skinfolds’ compressibility is constant. That is, the use of the SF method depends on the assumption that subcutaneous fat constitutes a constant proportion of the total body fat and that dehydration would not influence skin compressibility [20,21]. Therefore, biological variations such as subcutaneous tissue compressibility, differences in the proportion of fat that is located subcutaneously, and the distribution of fat over the surface of the body will induce error for calculating body fat content. For example, Araujo et al. [21] found that skinfold thickness was significantly higher after exercise-induced dehydration for all skinfold sites except for skinfold thickness at the iliac crest and abdominal sites. Skinfold compressibility may be related to body fluid content, physical fitness, gender, and disease state of the individual. Also, body fluid loss, either through physical exertion, heat stress, or diarrhea may influence skinfold thickness, but skinfolds’ compressibility did not change after dehydration [21]. The standard error of estimation (SEE) of body fat from the SF method is about 2-3% of body weight [22] or a total error (biological plus technical) for the prediction of body fat content of about 3.3% [13]. Under standardized conditions, however, the SF method has been frequently used for determining body composition with a relatively high validity compared to the UWW method [13,22-24].
The UWW method has been intensively studied and is based on the densitometry principle for calculating body density [5,6,9]. Its application is based on theoretical assumptions that the heterogeneous lean tissue compartment of the total body has a constant density [22], and that the state of hydration and the proportion of bone mineral to muscle in the fat free mass are constant [9,22]. For determining body fat, the UWW methods have a standard error of estimation of about 2-3% of body weight [22] or a total error (biological and technical error) of 3-4% [13]. For the past 20-30 years, the UWW method was the widely accepted reference method for determining body composition [6,22-24].
It is unknown to what extent dehydration can become a factor influencing body composition measurement. Thus, there is a need for evaluating these indirect methods under the influence of dehydration for determining body composition for clinical and nutritional intervention between obesity and overweight, and between under-nourishment and leanness. The purpose of this study is to examine the effect of exercise-induced dehydration on body composition measurement using these three indirect measurements.
Methods and Materials
Subjects:
Fifty physically active, healthy, normal weight adults (31 males and 19 females), age 23 to 64 years, were recruited as subjects for this study. The exclusion criteria include those with the following conditions: 1) known heart disease or respiratory disease, 2) history of myocardial infarction or coronary artery bypass surgery, 3) pregnancy, 4) history of claustrophobia, 5) history of heat injury, 6) diabetes mellitus, 7) physical inactivity for more than 6 months, 8) being unaccustomed to endurance-type exercise and heavy sweating, and 9) recent surgery (within the last 6 months). All subjects signed a written informed consent approved by the Institutional Review Board of Midwestern University. The procedures used in this study adhere to the principles of the Declaration of Helsinki.Procedure: To examine the effect of electrode placement on the BIA method for determination of body composition, a group of 20 subjects (9 males and 11 females) (Group 1) had their body composition determined using the BIA method with two different electrode placements. From the Group 1 BIA measurement, the lowest electrode placement procedure for measuring resistance (R) and reactance (Xc) were from right-wrist to right-ankle. For the BIA study we adapted the “right-wrist to right-ankle” electrode placement procedure. In addition, body composition of Group 1 subjects was also determined using the SF and UWW methods. Group 1 was not involved in the exercise protocol. In a second group of 30 subjects (22 males and 8 females) their body composition was measured before and after exercise-induced dehydration using the three indirect methods for determining FM, FFM, and %BF: the BIA, the SF, and the UWW in that order. To avoid electrolyte and fluid accumulation for body composition measurement, female subjects underwent all measurements 7-8 days after the end of their menstrual period. On the day of body composition measurement, all the subjects arrived at the laboratory after at least an 8-hour over-night sleep and a 3-4- hour fast.
Dehydration procedure: After baseline body composition measurements were completed Group 2 subjects began to dehydrate by engaging in at least 45 min of moderate intensity (65% of heart rate reserve or 65% VO2peak) exercise without fluid replacement and while wearing heavy warm-up clothing. The subjects used a stationary cycle ergometry, a treadmill, and/or outdoor running in a warm ambient temperature (78 - 80° F) to induce sweating. After 45 minutes of exercise, the subject was thoroughly dried and changed into dry shorts, and then weighed. When the body weight was 1.5% less than the initial weight, the subject discontinued the exercise and immediately (within 5-10 minutes) returned to the laboratory for repeated body composition measurement using the identical methods and measurement order. If the subject did not achieve the 1.5% weight loss, he/she continued to exercise for an additional 10 or 20 minutes and the weighing was repeated. However, if the subject was unable to achieve the required 1.5% weight loss due to physical fatigue, he/ she was permitted to return to the laboratory for the repeated body composition measurement. Their data were included in the statistical analysis. This occurred in < 10% (4 females) of the subjects. No fluid replacement was permitted during and after exercise-induced dehydration.
Study outcome measurements
Underwater weighing (UWW): The UWW method described by Pollock, Wilmore and Fox [25], and Behnke and Wilmore [5], was followed with modifications. Briefly, 24 hours before the UWW measurement the subject was instructed to avoid foods or drinks that could cause excessive gas to develop in the gastrointestinal track and cause acute body fluid loss or gain. The subject was completely exhaled the air volume in the lung (i.e., at residual lung volume), and then weighed in a sitting position inside a water-filled tank with the head and upper body completely submerged under water (Figure 1-a). A Chatillion 15-kg scale (Kew Hardens, N.Y.) calibrated in 20-g increments, was used to obtained subject’s underwater weight in grams. Gross underwater weight (GUW) was obtained using the following criteria [5]. The first trial for obtaining GUW was used as a practice and the value discarded. The subject was then weighed an additional six to nine times until three identical highest GUW readings were obtained. If three identical highest GUW readings were not obtained after 10 trials, then the second highest GUW was used if it was observed twice. If this was not attained, the third highest GUW value was used if it was observed twice. If none of these criteria could be met, the entire UWW procedure would be repeated. In the present study, no UWW measurement had to be repeated in order to meet the above criteria. The subject’s residual volume (RV) was measured using the helium washout system for each subject in a seated position outside the water-filled tank. At least two RV measurements were performed for each subject. When two RV differed by less than 50 ml, the average was used for calculation of body density. The RV measurement was taken either prior to (at least 1 hr) or after (less than 24 hr) the UWW measurement was completed. The percent body fat (%BF) was then calculated according to Brozék et al. [6]. The FFM and FM (both expressed in kg) were calculated from %BF and body weight.
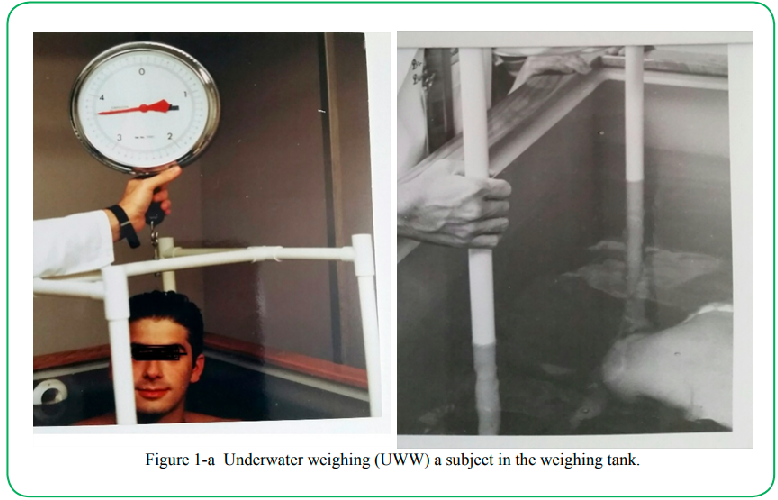
Figure 1-aUnderwater weighing (UWW) a subject in the weighing tank.
Bioelectrical impedance measurement: Determinations of resistance R and reactance (Xc) values were made using a four terminal impedance plethysmograph (RJL system, Quantum V, Detroit, MI) (Figure 1-b). A small amount of electrical current (800 micro Å alternating current) at 50 KHz was introduced at the distal electrodes of the wrist and ankle. The voltage drop was measured by the proximal electrodes placed on the same wrist and ankle. For the subjects in Group 1, four proximal electrodes were placed on both wrists and ankles, and four distal electrodes were placed on both metacarpophalangeal joints and metatarsophalangeal joints bilaterally. The lowest R and Xc values were identified from the right-wrist to right-ankle electrode placement. For group 2 subjects, the lowest R and Xc values were used for calculating FFM according to Lukaski et al. [7,8]. Three BIA measurements were recorded within three minutes post-dehydration in a supine resting position. The FM (expressed in kg) and body fat (in percent body weight) were then calculated from the FFM and body weight. The BIA plethysmograph was calibrated weekly against standard resistors ranges from 200 to 600 Ω.
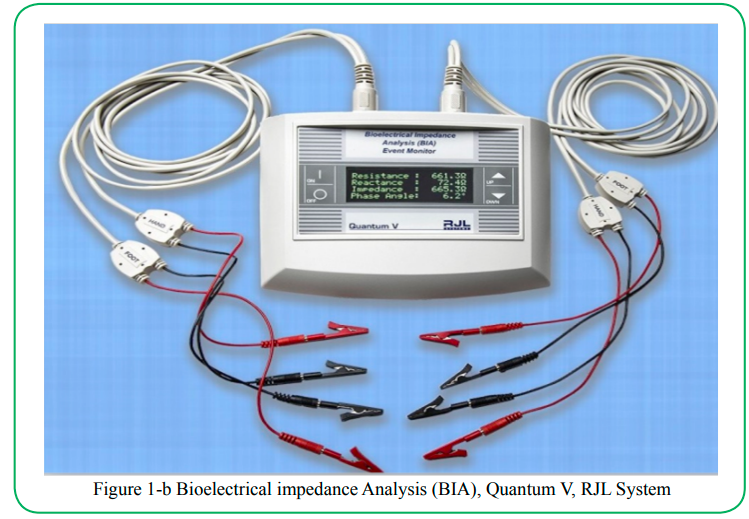
Figure 1-b Bioelectrical impedance Analysis (BIA), Quantum V, RJL System
Skinfold thickness (SF) measurement:
Seven SF sites were measured: triceps, subscapular, pectoral, midaxillary, suprailiac oblique, abdominal, and anterior thigh. All SF were measured on the right side of the body using Lange Skinfold caliper (Cambridge Scientific Industries, Cambridge, MD) (Figure 1-c). At least two measurements were taken at each skinfold site. When the two measurements taken at each site were greater than 1 mm, a third or fourth measurement was repeated. The nearest two values within 1 mm were averaged and used for calculating body density (Db) using the generalized equation of Jackson and Pollock for males [23] and females [24]. The %BF was then calculated according to Brozék et al. [6]. The FFM and FM (expressed in kg) were calculated from %BF and body weight.
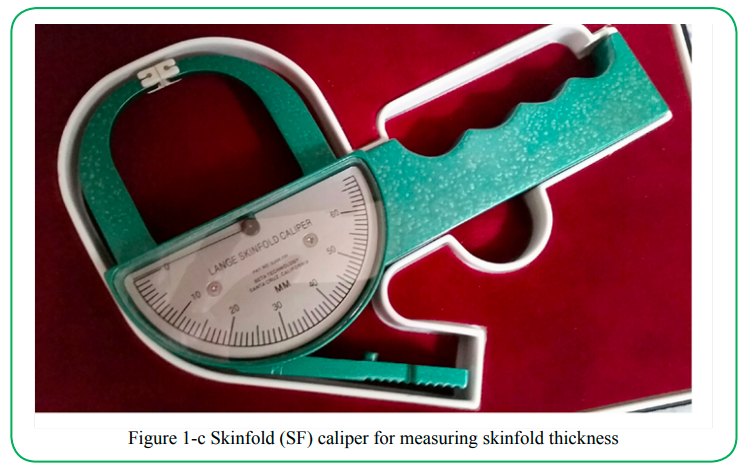
Figure 1-c Skinfold (SF) caliper for measuring skinfold thickness
Statistical procedures: We performed all statistical analyses using the SAS statistical software (version 8.0.2). Before the analysis, assumptions of equality of variance and normality were made. All variables tested between groups using ANOVA were continuously distributed. A 3 X 2 X 2 (method x dehydration x gender) analysis of variance (ANOVA), with repeated measures across all factors, was utilized to detect statistical significance. When a significant F-ratio occurred for the main effects or interactions, Scheffé post-hoc contrast tests were used to locate the source of differences among the methods, between pre- and post-dehydration, and between male and female for determining body composition. A Pearson correlation coefficient (r) analysis was used to examine reliability and validity of the methods used for obtaining %BF. Changes or differences in %fat content were expressed in absolute value in terms of percent of body weight. Fat content was expressed in absolute value in terms of percent of body fat (%BF). The 0.05 level of significance was used in all statistical analyses.
Results
The physical characteristics for Group 1 and 2 subjects and percentage of weight loss after exercise-induced dehydration are presented in Table 1. The degree of dehydration observed in our subjects averaged 1.5% (ranged from 0.7% – 3.6%) or 1.1 kg of body weight. Our results showed that there was a significant main effect in the determination of %BF and FM between pre- and post-dehydration treatment. In addition, there was a significant main effect in the determination of %BF, FM and FFM among the three methods for body composition measurement. There was also a significant interaction between body composition measurement method and dehydration. For example, the Scheffé post-hoc contrast tests applied to the %BF measurements showed that the BIA method significantly (p < 0.05) over-estimated %BF by 4.9% before dehydration and by 2.9% after dehydration compared to the SF method (Table 2). Relative to the UWW method for body composition measurement, the BIA method also significantly (p<0.05) over-estimated by 3.5 %BF before dehydration, but not after dehydration (i.e., 1.2%BF) (Table 2). In contrast, the SF method for measuring body composition showed a significant (p < 0.05) under-estimation of 1.7% body fat before dehydration and over-estimation of 1.7% body fat after dehydration, compared to the UWW method (Table 2).
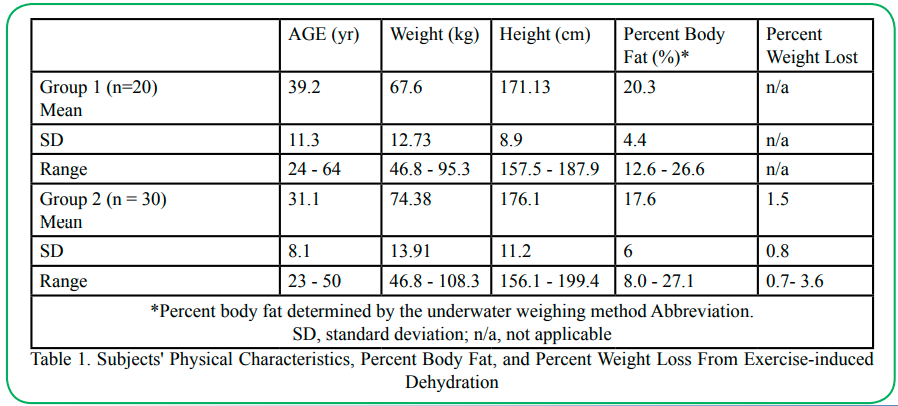
Table 1. Subjects' Physical Characteristics, Percent Body Fat, and Percent Weight Loss From Exercise-induced Dehydration
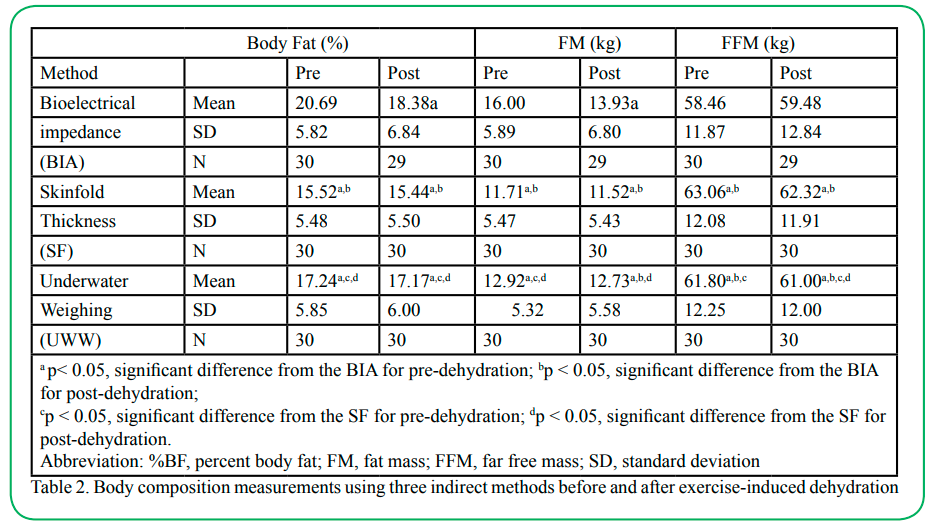
Table 2. Body composition measurements using three indirect methods before and after exercise-induced dehydration
Our results also revealed that the BIA method produced a markedly (p < 0.05) higher FM value than the SF method both before (4.3 kg) and after dehydration (2.4 kg) (Table 3). In addition, the BIA method also produced significantly (p < 0.05) higher FM value before (3.1 kg) and after-dehydration (1.2 kg), compared to the UWW method. Regarding FFM, our results showed that the BIA method significantly (p < 0.05) under-estimated FFM before (4.6 kg) and after dehydration (2.8 kg) compared to the SF methods (Table 2). Note that the BIA method significant under-estimated before (3.3 kg) and after dehydration (1.5%) compared to the UWW method (Table 2). Unlike the %BF and FM measurements, exercise-induced dehydration did not affect the before versus after dehydration FFM measurement using any of the body composition measurement methods.
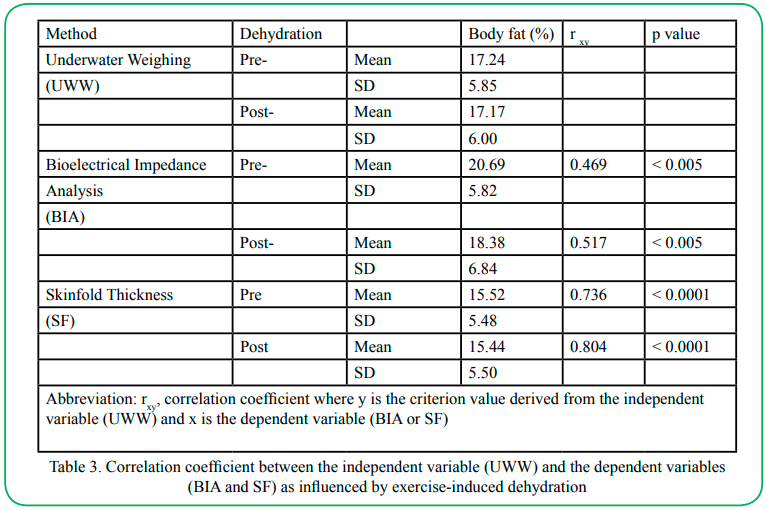
Table 3. Correlation coefficient between the independent variable (UWW) and the dependent variables (BIA and SF) as influenced by exercise-induced dehydration
Between the male and female subjects, there was a significant main effect for FFM but not for FM and %BF (data not shown). The Scheffe post-hoc testing revealed significant differences in %BF between male and female subjects with the BIA method for before and after dehydration. There were also significant differences in females’ %BF before dehydration between the BIA and SF methods (data not shown).
Discussion
There was no significant difference between the two different electrode placement procedures for measuring R and Xc values with the BIA. The differences were 3.8 Ω for R and 0.6 Ω for Xc (both p > 0.05). Our BIA measurement result agreed with that of Lukaski et al. who used the right-wrist to right-ankle electrode placement procedure with R = 40 Ω (7, 8). These observations suggest that the R and Xc values obtained from the BIA instrument using the right-wrist to right-ankle electrode placement procedure were acceptable for determining FFM.
Note that exercise-induced dehydration significantly (p < 0.05) affected FM measurement using the BIA method, but not the SF and UWW method. When Liang et al. [17] compared the BIA to that of the UWW method, they found that cold ambient temperature lowered skin temperature and skin blood flow which in turn influenced the BIA measures of R and Xc by underestimating FMM of young non-obese women, but not in neutral and hot ambient temperature. Liang et al. [17] also observed that differences in FFM measurement between cutaneous blood flow and BIA measurement, and between skin temperature and BIA measurement were very low, suggesting that BIA measurements were highly reliable [17]. The reliability of the BIA measurement for estimating body composition was also substantiated by other studies [3,7,8,16]. Liang and Norris [16] observed that relative to the UWW method, the BIA method showed a small and insignificant difference in obtaining %BF. They concluded that exercise-induced changes in blood flow and skin temperature do not influence the BIA assessment of FM or FFM [16].
Note that there was an under-estimation of %BF with the SF method using the Jackson and Pollack equations [23,24]. The reason for that is because the SF equation tends to underestimate %BF in lean individuals, especially women with lower fat content [22]. Our study subjects were in fact leaner than the general female population. Results obtained from the present study revealed that exercise-induced dehydration did not significantly affect the SF method for measuring body composition in the male subjects.
The UWW method is based on the assumption that the heterogeneous lean tissue compartment of the total body has a constant density [9,20]. This assumption may be correct for a homogeneous young population but is less likely to be true for an older population [26]. The UWW method was widely accepted as the reference method for determining body composition in the 1980s, and it does not appear to be affected by exercise-induced dehydration [18,19]. The reference method of body composition measurement has been shifted to a newer technology known as whole-body dual-energy X-ray absorptiometry which is a three-compartment model of body composition assessment: bone mass, soft tissue lean mass, and FM [27]. However, the use of the DEXA method for body composition assessment can also be affected by varying body hydration levels. For example, a 4% or 5% change in water content of FFM has a greater effect on body composition measurement, whereas a 1% to 3% change in water content can affect %BF measurement to a limited extent [12]. Caution should be used in interpreting these results because the relatively small number of female subjects who participated in the present study may limit the ability to generalize about the results.
Conclusion and Recommendation
In summary, exercise-induced dehydration (i.e., average 1.5% weight loss) significantly affected body composition measurement (i.e. FM) using the BIA method, but not the SF and UWW method. The BIA method significantly (p<0.05) over-estimated %BF by 4.9% before dehydration and by 2.9% post-dehydration compared to the SF method. The BIA method also significantly (p< 0.05) over-estimated BF by 3.5% before dehydration, but not after dehydration (i.e., 1.2 %BF) compared to the UWW. For both before and after dehydration, the BIA method of body composition assessment produced a high %BF value in female subjects compared to the males. When we compared the BIA method to the UWW method, a greater discrepancy in %BF was also found in the female subjects. We conclude that exercise-induced dehydration significantly affected body composition measurement of fat mass using the BIA method. Because of the overestimation of fat mass and underestimation of total fat free mass with the BIA method as determined in the dehydrated state as compared to the hydrated condition, we recommend that for body composition analysis using these indirect methods, especially the BIA method, the determination of hydration state of the subjects prior to assessing body composition should be conducted.
Acknowledgements:
The authors thank Stephen I. Greenstein, DO for measuring the subjects’ residual volume using the helium washout system, and Jacqueline R. Carter, Ph.D. for serving as the study statistical consultant. The authors wish to express our great appreciation to the participants for their effort, time and commitment to complete the entire study.
Conflict of interest statement:
Michael TC Liang, Thomas W Allen, and Mark E McKeigue declare that they have no competing financial interests, and have no professional relationships with the manufacturer’s instruments used in this project that may benefit from the results of this manuscript.
References
American College of Sport Medicine, ACSM’s Guideline for Exercise Testing and Prescription, 10th eds. Wolters Kluwer, Philadelphia, 2018. p. 66-81 and p. 217-221.
Toomey, C.M., Cremona, A., Hughes, K., Norton, C., & Jakeman, P. (2015). A review of body composition measurements in the assessment of health. Topics in Clinical Nutrition. 30(1) :16-32.View
Liao, Y-S., Li, H-C., Lu, H-K., Lai, C-L., Wang, Y-S., & Hsieh, K-C. (2020). Comparison of bioelectrical impedance analysis and dual energy x-ray absorptiometry for total and segmental bone mineral content with a three-compartment model. Int J Environ Res Public Health. 17, 2595. Doi:10.3390/ ijerph17072595 View
Taes, Y.E.C., Lapauw, B., Vanbillemont, G., Bogaert, V., DeBacquer, D., Zmierzak, H., Goemaere, S., & Kaufman, J-M. (2009). Fat mass is negatively associated with cortical bone size in young healthy male siblings. J Clin Endocrin Metab April 28, as doi:1210/jc.2008-2501 View
Behnke, A.R., Wilmore, J.H. (1974). Evaluation and Regulation of Body Build and Composition: Englewood Cliffs, New Jersey, Prentice-Hall, p. 20-24 and 32-37.
Brozék, J., Grande, F., Anderson, J.T., Keys, A. (1963). Densitometric analysis of body composition: revision of some quantitative assumptions. Ann NY Acad Sci. 110:113-140.View
Lukaski, H.C., Johnson, P.E., Bolonchuk, W.W., Lykken, G.I. (1985). Assessment of fat-free mass using bioelectrical impedance measurements of the human body. Am J Clin Nutr. 41 :810-817.View
Lukaski, H.C., Bolonchuk, W.W., Hall, C.B., Siders, W.A. (1986). Validation of tetrapolar bioelectrical impedance method to assess human body composition. J Appl Physiol. 60(4) :1327- 1332.View
Lukaski, H.C. (1987). Methods for the assessment of human body composition : traditional and new. Am J Clin Nutr. 46 :537-546.View
Duren, D.L., Sherwood, R.J., Czerwinski, S.A., Lee, M., Choh, A.C., Siervogel, R.M., Chumlea, x. (2008). Body composition Methods : Comparisons and Interpretation. J Diabetes Sci Technol. 2(6) :1139-1146.View
Kanellakis, S., Skoufas, E., Khudokonenko, V., Apostolidou, E., Gerakiti, L., Andrioti, M., Bountouvi, E., Yannis, Y. (2016). Development and validation of two equations based on anthropometry, estimating body fat for general population. Obesity.View
Blew, M.R., Sardinha, L.B, Milliken, L.A. (2020). Body composition laboratory methods. In: ACSM’s Body Composition Assessment, Timothy G. Lohman, Laurie A. Milliken, editors. Human Kinetics, Champaign, IL. p. 31-58
Lohman, T.G. (1981). Skinfolds and body density and their relation to body fatness: A review. Human Bio 53(2): 181-225.View
Piers, L.S., soares, M.J., Frandsen, x., O’Dea, K. (2000). Indirect estimates of body composition are useful for groups but unreliable in individuals. Int J Obes. 24(9) :1145-1152.View
Lohman, T.G., Milliken, L.A., Sardinha, L.B. (2020). Introduction to body composition and assessment. In: ACSM’s Body Composition Assessment. Champaign, IL; Human Kinetics. p. 1-16.
Liang, M.T.C., Norris, S. (1993). Effects of skin blood flow and temperature on bioelectrical impedance after exercise. Med Sci Sports Exerc. 25(11): 1231 1239.View
Liang, M.T.C., Su, H.F., Lee, N.Y. (2000). Skin temperature and skin blood flow affect bioelectric impedance study of female fat-free mass, Med Sci Sports Exerc. 32(1): 221-227.View
Pearman, P., Hunter, G., Kendricks, C., O’Sullivan, P. (1989). Comparison of hydrostatic weighing and bioelectric impedance measurement in determining body composition pre- and post dehydration. J Ortho Sports Phy Ther. 10(11) :451-455.View
Thompson, D.L., Thompson, W.R., Prestridge, T.J., Bailey, J.G., Bean, M.H., Brown, S.P., McDaniel, J.B. (1991). Effects of hydration and dehydration on body composition analysis : a comparative study of bioelectric impedance analysis and hydrodensitometry. J Sport Med Phys Fitness. 31(4) : 565-570.View
Womersley, J. and Durnin, J.V.C.A. (1977). A comparison of the skinfold method with extent of “overweight” and various weight-height relationships in the assessment of obesity. Br J Nutr. 38:271-284, 1977.View
Araujo, D., Teixeira, V.H., Carvalho, P., Amaral, T.F. (2018). Exercise induced dehydration status and skinfold compressibility in athletes : an intervention study. Asia Pac J Clin Nutri. 27(1) :189-194.View
Sinning, W.E., Dolny, D.G., Little, K.D., Gunningham, L.N., Racaniello, A., Siconolfi, S.F., Shoes, J.L. (1985). Validity of generalized equations for body composition analysis in male athletes. Med Sci Sports Exerc. 17(1): 124-130.View
Jackson, A.S., Pollock, M.L. (1978). Generalized equations for predicting body density of men. Br J Nutr. 40 :497-504.View
Jackson, A.S., Pollock, M.L., Ward, A. (1980). Generalized equations for predicting body density of women. Med Sci Sport Exerc. 12 :175-182.View
Pollack, M.L., Wilmore, J.H., Fox, III SM. (1984). Exercise in Health and Disease. Philadelphia : WB Suanders. p. 205-228.
John, S.H., Ellis, K.J., Vartsky, D. Sawitsky. A., Gartenhaus, W., et al. (1981). Comparison of methods of estimating body fat in normal subjects and cancer patients. Am J Clin Nutr. 34 :2839- 2847.View
Bea, J.W., Cureton, K., Lee, V., Milliken, L.A. (2020). Body composition Models and Reference Methods. In: ACSM’s Body Composition Assessment, Timothy G. Lohman, Laurie A. Milliken, editors. Human Kinetics, Champaign, IL. 2020. p. 17-29.