
- About the Journal
- Editorial Board
- Review Process
- Author Guidelines
- Article Processing Charges
- Special Issues
- Current Issue
- Past Issue
 Journal of Rehabilitation Practices and Research
Journal of Rehabilitation Practices and Research Volume 5 (2024), Article ID: JRPR-153
https://doi.org/10.33790/jrpr1100153Research Article
Relationship of BMI and FMS Scores in College Athletes
Steven Waite, Ph.D., CSCS, USAW
Assistant Professor of Exercise Science, Department of Kinesiology, California State University Fresno, United States.
Corresponding Author Details: Steven Waite, Ph.D., CSCS, USAW, Assistant Professor of Exercise Science, Department of Kinesiology, California State University Fresno, United States.
Received date: 26th November, 2024
Accepted date: 16th December, 2024
Published date: 18th December, 2024
Citation: Waite, S., (2024). Relationship of BMI and FMS Scores in College Athletes. J Rehab Pract Res, 5(2):153.
Copyright: ©2024, This is an open-access article distributed under the terms of the Creative Commons Attribution License 4.0, which permits unrestricted use, distribution, and reproduction in any medium, provided the original author and source are credited.
Abstract
Functional movement screening has become an integral part of the protocol for preparing athletes for training and competition. However, there is little evidence regarding the effectiveness of body size and mass distribution on performing common movement patterns necessary for competing in collegiate athletics. The purpose of this study was to determine the relationship between body size and movement pattern deficiencies in college athletes, as measured by Body Mass Index (BMI) and Functional Movement Screen™ (FMS) scores. Participants involved in this study included both male and female student-athletes. Measurements for BMI and FMS scores were taken for all participants and placed into specific categories according to evidencebased research standards for both measurements. The BMI scores were calculated for all participants and placed into four standardized BMI categories ranged from underweight (below 18.5%), normal (18.5-24.9%), overweight (25- 29.9%), and obese (30% and above). Participants were screened using the FMS, which was scored by two Level 1 FMS Certified (FMSC) raters following proper testing protocols. The FMS categories were broken down into passing and failing groups, with passing being a score of 15 or greater out of a possible 21 points. The outcomes were placed in a generalized rank-order and analyzed using the nonparametric L statistic to determine if a significant relationship existed. Data analysis revealed a strong relationship (p < .05) between BMI and FMS scores, concluding that an increase in BMI will lead to a decrease in ability to perform certain functional movement patterns and negatively impact overall movement proficiency. The outcomes of this study provide foundational insight to be used for further investigation on the impact and the relationship between body size and functional movement capacity in athletic populations.
Keywords: BMI, FMS, FMSC, underweight, overweight, obese.
Introduction
The Functional Movement Screen™ (FMS) has grown in popularity in recent years due to the positive impact of its successful screening protocols adopted by many fitness industry professionals and leading sports organizations world-wide. Gray Cook, a trained physical therapist and the co-founder of the FMS protocol, has made a huge impact on the role of screening protocols currently incorporated in the various avenues of athletics, rehabilitation, and other health and wellness industries [1,2]. Since the creation of the FMS, the screening protocol has been put to the test by practicing physical therapists, athletic trainers, strength coaches, and exercise science researchers to determine the effectiveness of the battery of exercises involved [3-5]. Likewise, many strength coaches have used the FMS as a go-to screening tool during the early preparation phases of training athletes [6]. While the testing protocol has proven to be a success in helping to identify common movement pattern deficiencies, the application of the outcomes from this assessment can often be a challenge to understand when comparing different athletic populations. One area of the assessment that has not been thoroughly investigated is the application of the screening protocol on comparing different college athletes based on body types. The purpose of this study was to determine the relationship between body size and movement pattern deficiencies in college athletes, as measured by Body Mass Index (BMI) and Functional Movement Screen™ (FMS) scores.
The goal of this study was to determine if there is a trend in movement pattern deficiencies that relate to body size when screening different college athletes using the FMS testing protocol. In theory, if evidence supports the concept of an athlete with a larger amount of body mass having less efficient overall movement capabilities, then strength and conditioning coaches will have a better understanding of what the outcomes of these screening protocols may indicate for the athletes they work with on a regular basis [7]. This is especially true for larger athletes, such as a lineman in football, where both movement (e.g., range of motion and joint mobility) and body mass are essential for performance [6,8]. Coaches working with these populations of athletes are tasked with identifying movement pattern deficiencies to correct form, improve performance, and prevent injury throughout training and competitive seasons [2]. Knowing the risk of body mass on movement pattern performances could help develop risk management protocols to prevent injury early on and enhance performance that can positively impact the individual and team effort [9,10].
The FMS protocol has been researched across a variety of athletic populations to determine the prevention of injury as well as the effectiveness of training [8,11,12]. The application of such research is often centered on how well the FMS identifies movement pattern deficiencies specific to an intended athletic population [13,14]. Recent research efforts have also been focused on identifying differences in FMS scores amongst genders within both secondary school and collegiate populations based on how well movement screening protocols identify progress in athletic performance [15,16]. There is strong support for the use of the FMS tool as a pre-season screening tool in collegiate athletic populations due to its ability to screen for movement deficiencies common amongst team sports [17,18]. However, research is lacking on general assessments of screening outcomes across all athletic populations based on body mass and how this relates to the movement deficiencies identified in these studies. If a trend does exist, improving body composition and the distribution of mass (e.g., replacing stored adipose tissue with functional muscle mass surrounding joints) may have a direct positive effect on performance and potentially decrease injury risk and occurrence [19,20].
It’s important to touch on the reliability of using the FMS as a screening tool for various athletic populations. Both interrater and intra rater reliability has been tested using the FMS protocol, with support from recent studies showing that trained researchers have a much lower variability in scores [21-24]. Retesting protocols have also shown that interrater reliability is sound with the protocol and grading format used in the scoring process involved in the FMS [25,26]. An area of potential concern with the FMS is participant knowledge of the movements and the scoring process that could alter the screening process [11]. Research by Frost and colleagues [11] determined that the FMS protocol was not as effective in determining dysfunctional movement patterns even when participants were aware of how to “correct” natural movements and attempt to hide deficiencies, suggesting that proper protocols should avoid telling participants how to effectively perform any of the seven movement patterns scored during the screening protocol. The design of this current study utilized two FMS certified (FMSC) researchers when collecting data, and followed the FMS testing guidelines, which supports the reliability efforts of the data collection procedures discussed in recent research findings [27].
The use of two certified FMS raters supports the reliability of outcomes due to the ability to assess and collaborate on scores from more than one angle of view [28]. The two raters used in this study observed each participant from two different angles, including side views and sagittal (front/back) views. The scores from both raters were reviewed and the lowest score for each exercise was accepted; the FMS testing protocol states that the lowest score should be taken since this leaves room for improvement and brings attention to the need for assessing possible movement pattern errors observed during the screening process [9,26]. Likewise, both raters were unfamiliar with the participants involved in the study to avoid bias on reporting results. This process helped to control the effect of inter-rater reliability since two non-bias raters were used to collaborate on FMS scores for each participant. In order to address intra-rater reliability, prior to participation, each participant was asked about his/her knowledge of the FMS testing protocol [22]. None of the participants used in this study had prior knowledge or experience with the FMS protocol, which helped to ensure that participants did not alter their performance based on prior knowledge of performing the seven exercises involved in the screening protocol [21]. Likewise, the proper testing protocols for executing each exercise involved in the FMS were followed using the FMS handout provided, which ensures that the raters do not “coach” athletes through the testing protocol [3,27]. This ensures that the outcomes of each movement are natural and not adjusted for the sake of performing a higher score [2].
Furthermore, there is a large body of evidence providing mixed outcomes on the effectiveness of the FMS protocol on identifying and predicting the risk of injury amongst the collegiate populations [16-18]. While injury prediction may not be a consistent and reliable factor when using this screening protocol, one thing that most research outcomes have in common is the theme that performance in sport, especially the ability to balance, jump, change direction, and move quickly, is related to functional movement abilities [29-32]. Likewise, most performance outcomes are highly related to the need for developing stronger core stability, which is one of the key components of performing many of the FMS movements successfully [33-35]. This concept supports the idea that body mass distribution could play a major role in movement pattern proficiency since limb length and mass distribution (e.g., body circumference) can impact core mobility and transfer of motion [36,37]. Research has also revealed correlations between BMI and fitness testing outcomes amongst various age groups of student-athletes, supporting the concept of comparing mass distribution with movement pattern ability to determine the likelihood of improving performance [19].
Assessing injury risk and movement proficiency has also been compared using various body analysis and composition techniques [20]. Most research supports the fact that BMI is not the best tool for assessing athletic populations since it is not an analysis of actual body composition; it does not assess lean mass versus fat mass [38]. Some research supports the use of abdominal circumference as a better choice over BMI in determining risk of musculoskeletal injury [39]. However, this study proposed the effect of overall mass on potential movement deficiencies, rather than the risk of injury in sport.Therefore, the impact of BMI as a predictor of injury based on the accuracy of assessing specific body composition was not in question. Russell and colleagues [40] researched the effectiveness of using BMI to predict body fat in female collegiate athletes, and the results suggested that excess mass often resulted in poor performance in sports that required optimal movement proficiencies which supports the research design presented in this study design. Furthermore, Joshi and colleagues [41] found that BMI scores were effective in determining trends in fitness scores in schoolchildren. While BMI does not have the best reputation for assessing athletic populations, research findings do indicate there is plausible reliability in determining trends between movement ability and body mass as determined by BMI scores [41,20]. This study was designed to determine if a relationship exists between BMI and FMS scores amongst collegiate athletic populations.
Research Question
Is there a relationship between body size and movement pattern deficiencies in college athletes, as measured by BMI and FMS?
Null Hypothesis
There was no relationship between body size and movement pattern deficiencies in college athletes, as measured by BMI and FMS scores, respectively.
Participants and Instrumentation
Participants involved in this research included both male and female student athletes enrolled at a four-year university in central California. All participants were full-time college students required to be above the age of 18 years in order to participate in the study. Participant ages ranged from 18-24 years with a mean age of 21. Each participant involved in this study was a current student athlete competing for an NCAA DII collegiate program with experience levels ranging from freshman (first year) through senior (final year). The training status of each athlete varied based on competitive season and time spent training and competing at the DII collegiate level. Every participant disclosed his/her fitness and ability to perform movement pattern exercises. No participants involved in this study reported any current or recent injuries that would limit his/her ability to perform any of the exercises involved in the FMS testing protocol. The performance-specific demographics of these athletes varied according to sport, which included men’s baseball, men’s and women’s soccer, women’s volleyball, and both men’s and women’s track and field athletes. Each participant also had to be cleared from any recent injury by university athletic trainers, but did not have to be in-season or actively involved in a strength and conditioning program at the time of testing.
This research study utilized two instruments including the FMS Test Kit® for the physical screening process, and a Detecto Physician Scale™ that measured both weight and height for determining BMI scores for each participant. The FMS has a series of seven functional movement tests that are performed in sequential order [27]. The seven tests consist of the following, in order: Deep Squat, Hurdle Step, Inline Lunge, Shoulder Mobility, Active Straight-Leg Raise, Trunk Stability Push-Up, and the Rotary Stability test. Participants were allowed to perform each of the seven exercises up to three attempts, and were also required to perform two clearing tests including the Press-Up and Posterior Rocking test [1]. The clearing tests were used to identify possible predisposed injuries or impingements, including a shoulder impingement associated with the Shoulder Mobility movement as well as any sign of musculoskeletal injuries of the spinal region prior to attempting the Trunk Stability Push-Up and Rotary Stability tests, respectively [27].
The FMS equipment consists of a 5-foot plastic 2 x 6 hollow board, along with a 4-foot dowel, two smaller 2-foot dowels and a thin elastic red tube with loops on each end. This equipment is used for five of the seven functional movement exercises involved in the screening test, while the Shoulder Mobility and Trunk Stability Push-Up tests are the only two exercises performed without any necessary equipment. The large dowel is used for the majority of the tests, including the Deep Squat, Hurdle Step, Inline Lunge, and Active Straight-Leg Raise. The plastic board is used for the Hurdle Step, Inline Lunge, Active Straight-Leg Raise, and the Rotary Stability tests. The smaller dowels and the red rubber chord are only be used for the Hurdle Step exercise. Instructions pertaining to the execution of the test and proper set-up of equipment can be found in the FMS Manual [27].
The scale used for measuring weight and height was a Detecto Physician Scale™. The scale consists of the traditional aluminum frame with a die-cast aluminum weight beam, which displays written measurements for weight in both pounds and kilograms. The scale also has a height rod that displays written measurements for height in both inches and centimeters. The measurements taken for each participant, including both weight and height, were recorded in kilograms and centimeters, respectively, and used to calculate BMI scores based on the BMI formula (Appendix B). The formula used determines body mass (e.g., body weight), divided by the square height on the participant [42].
Study Procedures
Before beginning the screening processes using the FMS and collecting measurements for calculating BMI scores, an Institution Review Board (IRB) approval was obtained by the PI. The screening process was performed with all participants using the FMS Test Kit® and a Detecto Physician Scale™. The Detecto scale was first used to determine the measurements needed for calculating BMI scores for all participants, including height and weight in centimeters and kilograms, respectively. The screening process using the FMS Tool Kit® involved all seven of the FMS tests, which were scored by one of the two Level 1 Certified FMS (FMSC) raters using the FMS score sheet (Appendix C). Any muscular asymmetries and/or deficiencies for each participant were noted by the two FMSC raters during the screening process and recorded according to the protocols found in the FMS manual [27]. The screening process of this study was performed in a human performance lab setting, where participants from each of the participating sports teams were tested using the Detecto Physician Scale™ and FMS Tool Kit®.
Steps for the testing procedures began with each participant filling out a consent form (Appendix D) and a liability release form (Appendix E). Participants were then asked to step on the Detecto scale while the FMSC rater recorded weight in kilograms and height in centimeters. These measurements were used for calculating BMI scores by utilizing the metric scale to determine weight in kilograms and height in meters squared. BMI scores were later calculated from the recorded weight and height measurements recorded by dividing the weight (in kilograms) by the height (in squared meters). The resulting scores were used to place each participant in one of the four categories, including underweight (below 18.5%), normal (18.5- 24.9%), overweight (25-29.9%), and obese (30% and above).
The FMS protocol took place following height and weight measurements; each participant took approximately 15-120 minutes to score using the FMS scoring sheet. The test scores were recorded for each participant based on the 21-point grading scale (Appendix C). The participant scores were then placed in an Excel spreadsheet (Appendix E) and displayed in the sport specific results tables located in the Appendix section. The information recorded for both tests were placed into the respective categories. This screening process took place during the spring semester, allowing enough time to organize screening tests for each athletic team involved in the study. The data collected from the screening process were used to determine the relationship between the two measurements based on the different demographics of the participants involved in the study.
Data Analysis
The data from this study were recorded in an Excel spreadsheet and analyzed using SPSS software. Both BMI and FMS scores were collected using the proper execution of instrumentation and procedures. The data for both tests were first recorded by hand using an FMS Score Sheet (Appendix C), which provided space for the FMSC rater to record height, weight, and score all seven of the exercises involved in the FMS protocol [27]. This data was then transferred to an Excel spreadsheet, where BMI scores were calculated using the recorded weight and height measurements and the standard BMI formula. The resulting BMI scores for each participant were then categorized according to the standard percentages set by the World Health Organization’s (WHO) International Classification of Adult Underweight, Overweight and Obesity According to BMI [43] chart (Appendix A). The recorded FMS scores were also categorized according to the pre-determined passing score of 15 out of a possible 21 points [44]. Mean values and standard deviation for the BMI scores and FMS scores were calculated and recorded separately for each participating sports team. The percentages of scores for all of the mean values were recorded in tables representing each descriptive category.
A correlation analysis was performed using the Puri and Sen L Statistic (1969; 1985) to determine if a significant relationship exists between the recorded BMI and FMS scores recorded in this study [45]. The L statistic used in this study involved a generalized rankorder method for nonparametric analysis of data involving both the BMI and FMS scores recorded. The nonparametric L statistics test was performed using SPSS software, revealing a level of significance based on the formula L = (N – 1)r2. According to the chi square table, the level of significant difference between the two groups tested is based on the value of difference between the two measurements in comparison to the critical value. The level of significance between the two measurements was established at p < .001.
Results
The following reveals the results of the data analyzed in determining the relationship between body size and movement pattern deficiencies, as measured by BMI and FMS scores, respectively. The demographic statistics section explains the background and details about the participants used in this study. The descriptive statistics breaks down the data collected, including how it was all categorized into respective tables. The statistical analysis section reports the results found using the correlation analysis method, revealing the relationship between the BMI and FMS scores.
Demographic Statistics
The screening process for this study was completed by 85 student athletes, which included 54 male and 31 female athletes. The testing procedures took approximately 15-20 minutes to complete per participant. The participants ranged from 18 to 24 years of age, with a mean age of 21 years. All 85 participants were enrolled as full-time student athletes and were actively participating in one of the six sports teams involved in the study. The six sports teams that athletes volunteered from to participate in this study included men’s and women’s soccer, men’s baseball, women’s volleyball, and the men’s and women’s track teams.
Descriptive Statistics
The participants were divided into six categories during the screening process, with each category representing the six sports teams that participated in this study. As seen in Table 1, there were 25 male soccer athletes, 14 female soccer athletes, 22 male baseball athletes, 10 female volleyball athletes, 7 male track athletes, and 7 female track athletes.
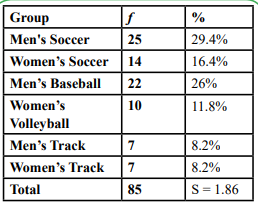
Table 1: Number of Participants by Group
The data collected separately for all 85 participants for BMI and FMS scores were recorded on an FMS score sheet (Appendix C) and matched electronically using an Excel spreadsheet (Excel tables found in Appendix G). Mean (X̄) scores for the BMI scores and FMS scores were calculated and recorded separately for all six participating sports teams. Table 2 shows the X̄ BMI and FMS scores and the standard deviations (SD) for each of the six participating sports teams along with the total X̄ values for both BMI scores and FMS scores.
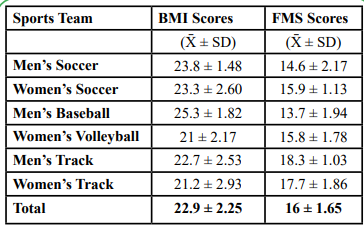
Table 2: Mean and Standard Deviation for BMI and FMS Scores
The mean values from the overall results of all 85 participants were used to calculate the percentage of scores for each BMI category. The mean underweight category made up 3.5% of the population, the mean normal category was 71.8%, and the mean overweight category was 24.7% of the population tested. There were no obese scores for any of the population tested in this study. Table 3 reveals the overall percentage breakdown of the four BMI categories as described.
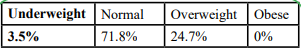
Table 3: Overall BMI Category Percentages
The overall FMS results for both passing and failing categories were also used to calculate the percentage of scores for both FMS categories between the 85 participants. A passing score was achieved by a collective score of 15 or more points out of a possible 21 points according to the FMS scoring sheet (Appendix C). The mean score for overall passing FMS scores was 64.7% of the population, while the failing scores included 35.3% of the population tested. Table 4 reveals the overall percentage breakdown for the number of passing and failing FMS scores.
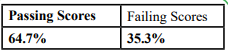
Table 4: Overall FMS Category Percentages
Statistical Analysis
What was the relationship between BMI scores and FMS scores in identifying movement pattern deficiencies in college athletes? An L statistic correlation analysis was performed using the recorded overall BMI and FMS scores to determine if a significant relationship exists between the two measurements for all 85 participants. A generalized rank-order method for nonparametric analysis of data was used to determine the level of significance using the formula L = (N – 1) r2[45]. The L statistic analysis revealed a significant relationship between the two measurements, L(1) = 13.02; p < .001. Table 5 reveals the calculations and analysis of data used to determine this relationship.
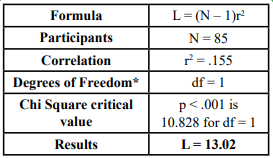
Table 5: Calculations and Analysis
As shown in Table 6, the chi square critical value at p < .001 is 10.828 for df = 1. This reveals that the L value is greater than this critical value. Therefore, the findings reveal that this is a significant relationship. The probability that this relationship between BMI and FMS scores is by random chance only is less than .001, or less than 1 in 1,000 chances. Figure 1 displays a scatter plot of the BMI and FMS scores for each participant revealing the relationship between BMI and FMS scores. The inverse linear trend line reveals that as BMI scores go up, FMS scores go down. This graph reveals the relationship of high BMI scores and low FMS in college athletes, thus disproving the null hypothesis of this study.
Discussion
The following addresses the findings of this research study by summarizing the results and making conclusions based on evidence revealed and connections to other studies referenced. The conclusion section focuses on the results based on the statistical analysis outcomes, while the discussion section addresses the overall findings in comparison to other related literature and research findings. The limitations section clarifies possible limiting factors that may have affected the accuracy of the findings from this study and the degree to which the results can be utilized. The practical applications section addresses the current need for identifying simple solutions to screening college athletes by giving insight on how this research can be put to use in athletic settings. The recommendation for future research provides insight on future studies to be conducted to further investigate topics relating to this study design.
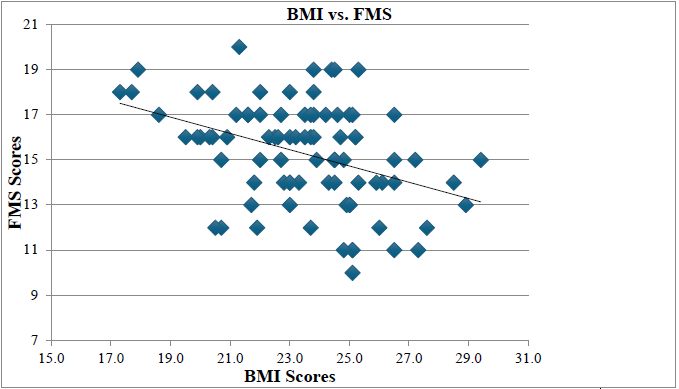
Figure 1. The inverse linear relationship between BMI and FMS scores. This figure illustrates the direction of the trend line for the data being analyzed.
Summary of Results
Based on the outcomes of the results, it can be concluded that there is a strong relationship between body mass and movement pattern deficiencies in college athletes, as measured by BMI and FMS scores, respectively. The Puri and Sen L statistics analysis performed on the overall BMI and FMS scores for all 85 participants revealed a significant relationship, L(1) = 13.02; p < .001. The actual BMI and FMS results varied within each team, suggesting there could be other factors to consider for future research. Prior research has been conducted using both measurements, much of which supports the relationship between body mass and the performance of functional movement patterns in athletes and the general population. The findings from recent studies utilizing either BMI or FMS are discussed and compared to the results from this study in concluding the significance of the findings.
Conclusion of Results
The purpose of this study was to determine the relationship between body size and movement pattern deficiencies in college athletes, as measured by BMI and FMS scores, respectively. The findings of this study disprove the null hypothesis, concluding that there is a strong relationship between body mass and movement pattern deficiencies in college athletes. This inverse trend line identified in Figure 1 supports the hypothesis of this study by displaying the relationship between high BMI scores leading to low FMS scores. Participants having overweight BMI scores most often had failing FMS scores, as displayed in Figure 1, while participants with normal BMI scores most often achieved passing FMS scores. This pattern reveals a strong relationship between the two measurements in identifying movement pattern deficiencies. However, this relationship was slightly less apparent in men’s baseball and men’s soccer, suggesting there could be less of a correlation between BMI and FMS in certain male athletes. This may be due to the fact that there was a greater population sample for both of these teams, and a larger number of athletes having overweight BMI scores and failing FMS scores in comparison to the other four sports teams involved in this study.
The results from the L statistic analysis support the fact that college athletes having high BMI scores will more than likely result in low, or failing, FMS scores (L = 13.02; p < .001). These results revealed that participants who had overweight BMI scores most often resulted in some level of movement pattern deficiency as revealed by a lower FMS score of less than 15 points (e.g., a failing score). For example, when comparing the BMI and FMS scores of the women’s volleyball team, the results revealed that athletes having high BMI scores that fell into the overweight category were guaranteed (100% certainty based on results) to have a failing FMS score. This is true given that the only overweight athlete on this team also had a failing score. Likewise, the men and women’s soccer teams had multiple athletes ranging in the overweight BMI category, with more than 75% of those athletes having failing FMS scores. The men’s baseball team, on the other hand, revealed that the total number of athletes with failing FMS scores was about even in relations to those having normal BMI scores, in relation to those who were considered to be overweight. However, this outcome may be due to limiting factors, such as the validity of using BMI scores to estimate body composition in larger male athletes, the difference between lean mass and fat mass found in the male participants, or even the overall affect that excessive body mass had on limiting movement pattern efficiency [20,40].
While it can be concluded that there is a strong relationship between body mass and movement pattern deficiencies in college athletes, this relationship can depend on the type of athlete being screened, especially in regards to male athletes with larger body types [20]. Further research is likely needed in determining the best form of body composition assessment (i.e., mass versus composition differences) and how it can be used to aid the process of identifying movement pattern deficiencies in college athletes. BMI was useful in this study by determining the impact of mass on movement deficiency trends in the athletic populations addressed in this study. However, other common NCAA athletic populations not addressed in this study should be considered in follow up studies, including larger athletic populations such as men’s American football, women’s softball, and possibly water polo players. For example, a majority of the players from the men’s baseball team had overweight BMI scores, yet not all of them were considered to be unfit in regards to performing in their sport-specific positions. The proof is in the results of the FMS scores, which revealed that the majority of the baseball athletes did not have functional movement pattern deficiencies in comparison to the corresponding number of players with overweight BMI scores. Likewise, the number of overweight BMI scores was greater in both men’s baseball and men’s soccer in comparison to the other sports teams involved in the study. This suggests that BMI may be a poor indicator for estimating body composition in male athletes, especially in men’s baseball, due to the larger, more muscular body build of these athletes [20].
Therefore, invalid results may have occurred when testing many of the male athletes having greater amounts of lean muscle mass, which BMI doesn’t take into account [40]. Other body composition testing protocols (e.g., skin fold testing) may be more successful in establishing a strong relationship with corresponding FMS scores when testing male athletes with larger body types [20]. Regarding the impact on this study, BMI does not limit the outcomes of this study since the focus was on comparing overall body mass on movement pattern performance. There is no evidence from clinical trials to support how the precise measurements of lean versus fat mass have a direct impact on movement outcomes. Research only supports the impact of body fat percentage on health outcomes not related to functional movement in collegiate athletes [19,20]. The implications of BMI suggest that higher scores in some athletic populations, such as baseball players, would likely have higher muscle mass. However, athletic populations with larger athletes competing, such as American football, was not involved in this study. Therefore, it is difficult to assume if larger mass due to both muscle and fat would result in the same outcomes. Further investigation is needed on this topic relating to athletes with larger mass in general.
Discussion of Results
The findings of this study are unique given that no previous research has established a relationship between BMI and FMS scores in college athletes. However, as previous studies have shown, BMI has been used for assessing general health concerns while FMS scores have been regularly researched in regards to screening effectiveness [3,41]. Both have been proven as reliable tools in evaluating health status and in screening the physical needs of college athletes over the past decade [15,19]. The use of both measurements has also proven to be effective in developing and establishing standards for evaluating specific areas of interest, ranging from body composition to the specific physical attributes, including strength, coordination, balance and flexibility, all of which are involved in the functional movement patterns utilized in many college-level athletics. Furthermore, many studies have been successful in using the FMS and similar testing protocols for functional movement screening to help predict the common movement pattern deficiencies that tend to cause injuries in college athletes, especially in female athletes, where repetitive and non-contact injuries are at the highest level of concern [16,17]. Since all of these factors play a role in athletic performance, evaluating an athlete based on these conditions is relevant in better understanding the guidelines for optimal performance and in preventing sport-specific injuries from occurring.
Research supporting the use of FMS in evaluating the type of movement patterns required in multiple sport-specific settings has led to its widespread use in today’s largest sporting arenas. Beardsley and Contreras [3] came to the conclusion that the objective of measurement of the FMS is intended to be “compensatory movement patterns” as they are performed during sporting activities. Furthermore, Chorba et al. [16] state that the FMS was designed to challenge the interactions of kinetic chain mobility and stability necessary for performance of fundamental, functional movement patterns. These movement patterns are the foundation for the neuromuscular execution of a variety of both athletic and occupational movement requirements [16]. This would suggest that the movement patterns used in the testing process of the FMS are similar to those found in the movement patterns utilized in sporting activities, making the FMS a valid screening tool for identifying functional movement pattern and possible muscular deficiencies in college athletes. Understanding how this performance-based evaluation tool relates to an athlete’s body composition is what led to the design of this study and its application towards advancing the screening process of preparing individuals for competing in college athletics.
The BMI standards set forth by the World Health Organization [43] (Appendix A), and the research supporting the standard passing score of 15 points for the FMS, both served as key components in the process of analyzing scores between the two measurements [46]. The statistical analysis portion of this study utilized both of these standards as benchmarks for evaluating each measurement for every participant, and played a large role in the outcome of the data analysis section. The International Classification of Adult Underweight, Overweight and Obesity According to BMI (2004) chart, Table 1, found in the Appendix section, was useful in determining which BMI category each participant was to be placed in, based on the calculated values. Likewise, the article referring to normative values for the FMS by Schneiders et al. [46] was very helpful in establishing the standard passing FMS score of 15 points. Other research supported this standard as a passing FMS score in athletic populations, versus that of the general population, which was used for the placement of participants from this study in either the passing or failing category based on individual FMS scores [33,44].
The downside to using these research-supported standards is the limited number of findings supporting the accuracy of each measurement guideline when testing athletic populations. This is especially true for BMI, due to the amount of criticism received over the validity of testing certain types of athletes, as mentioned previously [19,39]. Likewise, the FMS has limited research supporting the rater accuracy and interpretation of the grading process [2,14]. However, the standards used for evaluating both measurements in this study design were based on previous studies that revealed successful results when testing similar populations. These research findings were useful in providing evidence of an accurate and reliable scoring process, which is why both were referenced and utilized in this study.
There is still debate among fitness professionals that the BMI formula is a poor indicator of an athlete’s true body composition [39]. This is mostly due to the fact that the BMI formula doesn’t take into consideration the amount of lean muscle mass present [40]. However, this factor may be irrelevant to this study since the type of excessive mass isn’t necessarily the determining factor for the performance of functional movement patterns [41]. It is also important to note that this factor is based on an individual scale since everyone has a different body physique [19]. Some athletes, whether taller or shorter than the norm, are built naturally lean, while others are built stockier. For athletes with a shorter and stockier build, it’s safe to assume that the BMI formula wouldn’t be the best screening tool in determining body composition because the result would most likely always place him/her in the overweight category regardless of his/her true lean-to-fat mass ratio [40,43]. Likewise, with athletes who are very tall and lean, the BMI formula will most likely place him/her in the underweight category even if the athlete is at a healthy weight and has a healthy power-to-weight ratio.
This study didn’t seek to prove that the type of body mass of an athlete will determine his or her ability to perform, since excessive fat mass and excessive muscle mass can both be limiting factors in joint ROM [40]. Therefore, it’s safe to assume that the type of body weight being measured is irrelevant to this study since any source of excessive mass can, hypothetically, have a negative effect on the ability to perform functional movement patterns. This study proved that excessive mass, in the measured form of a weight-to-height ratio (e.g., BMI scores), has a significant effect on the ability of an athlete to perform common functional to perform common functional movement patterns, as displayed by the inverse trend line found in Figure 1. The higher the BMI of an athlete, the greater likelihood he/ she will perform lower on the FMS. This inverse linear representation reveals the relationship between BMI and FMS scores for identifying movement pattern deficiencies in college athletes.
Limitations
While the results found in the statistical analysis section support the hypothesis of this study, there are still a number of limitations involved in the design of this research. These limitations include, but are not limited to, the sampling size of the participants used, the type of participants involved (e.g., gender and sport position), the quality and accuracy (i.e., reliability) of scores recorded by the researcher, the validity of the data collection process, the standards set for each measurement, and even the effect of participant knowledge of the FMS prior to the start of this study [11,47]. Two important limitations to look into for further research on this topic would include inter- and intra-rater reliability, which can have a direct effect on the outcome of the FMS scores affecting the results of the data collection process [21-26]. The limitations of these factors were previously discussed and were found to be mitigated due to the protocol used in this study. The design of testing with two FMSC raters and having non-bias relationships between the raters and participants being screened, showed to be effective in producing sound results.
The population is participants is another possible limitation discussed. While not all collegiate sports were represented, there was fairly equal representation between genders. Further investigation needs to be made regarding the population of athletes competing in sports that were not included in this study. Likewise, comparisons should be made of athletes competing at various levels of college athletics, which could include community college, NAIA, NCAA DI and DIII levels. This study assessed NCAA DII athletes, which is only one of the many collegiate levels of competitive athletics offered nationwide. While all of these limitations may have played a role in the outcome of this study, further research may be done to successfully identify the extent of any one of these limitations on the results found.
Practical Applications
The FMS offers a practical and simplistic strategy for measuring functional movement patterns that directly apply to the demands of many sporting events [2,7]. Not only does it measure the demands of movement, but it also helps athletic trainers and strength coaches in the often-complex process of identifying specific areas of weakness that could possibly lead to injury, if not addressed properly [17]. Furthermore, understanding the relationship between body mass and its effect on functional movement is a key factor in the continued success of injury prevention and athletic performance of college athletes [41]. Together, these measurements can be effective in achieving the ultimate goal of reducing deficiencies in the performance of functional movement patterns, and support the progression towards improved athletic performance in college athletics nationwide. Ultimately, this study provided insight on the effectiveness of comparing body mass and movement patterns, as measured by BMI and FMS scores, in providing a simplistic approach to identifying common functional movement deficiencies in college athletes.
Recommendations for Future Research
Based on the results shown in Table 6 and Figure 1 in the statistical analysis section, it can be concluded that there is a strong relationship between body mass and movement pattern deficiencies in college athletes, as measured by BMI and FMS scores. However, further research can be done in identifying the significance of the relationship between these two measurements in regards to the different types of athletes being tested. Other forms of body composition testing (e.g., skin fold testing, Bod Pod, or DEXA scans) can be more accurate in determining body fat percentages in athletic populations. Therefore, a case can be made for researching the usefulness of the BMI formula in reliably identifying the categorized body size of athletes. It is recommended that further research be done in determining the relationship between body fat percentages and FMS scores in identifying the effects of fat mass versus lean muscle mass on the performance of functional movement patterns. Further research in the application and process for measuring different forms of body composition and functional movement patterns in college athletics would be beneficial in identifying the usefulness and application of both measurements in comparison to other screening tools.
Conflicts of Interest:
The author declares there is no competing interest in the authorship of this paper.
References
Cook, G., Burton, L., Fields, K., Kiesel, K. (1998). The Functional Movement Screen. Danville, VA: Athletic Testing Services Inc.
Kraus, K., Schutz, E., Taylor, W. R., & Doyscher, R. (2014). Efficacy of the Functional Movement Screen: A review. Journal of Strength and Conditioning Research, 28(12), 3571-3584. View
Beardsley, C., & Contreras, B. (2014). The Functional Movement Screen: A review. Strength and Conditioning Research, 36(5), 72-80.View
Cook, G., Burton, L., & Hoogenboom, B. (2006). Pre-participation screening: The use of fundamental movements as an assessment of function—Part 1. National American Journal of Sports Physical Therapy 1, 62-72.View
Parenteau, G. E., Gaudreault, N., Chambers, S., Boisvert, C., Grenier, A., Gagne, G., & Balg, F.(2014). Functional Movement Screen test: A reliable screening test for young elite ice hockey players. Physical Therapy Sport, 5, 169-175. View
Bush, G. (2013, December 13). Stanford’s distinct training regimen redefines strength. The New York Times. Retrieved from http://www.nytimes.com/2013/12/31/sports/ncaafootball/ stanfords-distinct-trainingregimen-redefines-strength. html?pagewanted=1&_r=1& View
Parchmann, C. J., & McBride, J. M. (2011). Relationship between Functional Movement Screen and athletic performance. Journal of Strength and Conditioning Research, 25(12), 3378-3384. View
Kiesel, K., Plisky, P., & Butler R. (2011). Functional movement test scores improve following a standardized off season intervention program in professional football players. Scandinavian Journal of Medicine and Science in Sports, 21(2), 287-292. View
Cook, G., Burton, L., Kiesel, K. B., Rose, G., & Bryant, M. F. (2013). Movement: Functional Movement Systems – screening, assessment, corrective strategies. Aptos, CA: On Target Publications. View
Palmer, T. G., Howell, D. M., Mattacola, C. G., & Viele, K. (2013). Self-perceptions of proximal stability as measured by the Functional Movement Screen. Journal of Strength and Conditioning Research, 27(8), 2157-2164. View
Frost, D. M., Beach, T. A., Callaghan, J. P., & McGill, S. M. (2013). FMS™ scores change with performers' knowledge of the grading criteria - Are general whole-body movement screens capturing "dysfunction"? Journal of Strength and Conditioning Research, Post Acceptance, November 20, 2013. View
O’Connor, F. G., Deuster, P. A., Davis, J., & Knapik, J. J. (2011). Functional Movement Screening: Predicting injuries in officer candidates. Medicine and Science in Sports and Exercise, 43(12), 2224-2230.View
Butler, R. (2011). Summary literature review of FMS research statement and review. In Butler, R. (2011) Literature review of FMS. FMS research statement and review. Retrieved from http:// www.functionalmovement.com/articles/Research/2011-03-07_ research_statement_and_reviewView
Whiteside, D., Deneweth, J. M., Pohorence, M. A., Sandoval, B., Russell, J. R., McLean, S. G.,… Goulet, G. C. (2015). Grading the Functional Movement Screen™: A comparison of manual (real-time) and objective methods. Journal of Strength and Conditioning Research, (Publish Ahead of Print). View
Anderson, B. E., Neumann, M., & Huxel Bliven, K. C. (2015). Functional Movement Screen™differences between male and female secondary school athletes. Journal of Strength and Conditioning Research, (Publish Ahead of Print). View
Chorba, R. S., Chorba D. J., Bouillon, L. E., Overmyer, C. A., & Landis, J. A. (2010). Use of a functional movement screening tool to determine injury risk in female collegiate athletes. National American Journal of Sports Physical Therapy, 5(2), 47-54.View
Dorrel, B., Long, T., Shaffer, S., & Myer, G. D. (2018). The Functional Movement Screen as a predictor of injury in National Collegiate Athletic Association Division II athletes. Journal of Athletic Training, 53(1), 29–34. View
Mokha, M., Sprague, P. A., Gatens, D. R. (2016). Predicting musculoskeletal injury in National Collegiate Athletic Association Division II athletes from asymmetries and individual-test versus composite Functional Movement Screen scores. Journal of Athletic Training,51(4), 276–282. View
Brignac, A., Bellar, D., Judge, L. W., Smith J., Mazerat, N., & Trosclair, D. (2011). The relationship of BMI to grade point average, age, and multiple fitness tests. Journal of Strength and Conditioning Research, 25(1), S121. View
Thompson, B., Cain, G. J., & Jones, M. T. (2010). Relationships between body composition and performance measures in division III football players. Journal of Strength and Conditioning Research, 25(1), S35. View
Gribble, P. A., Brigle, J., Pietrosimone, B. G., Pfile, K. R., & Webster, K. A. (2013). Intrarater reliability on the Functional Movement Screen. Journal of Strength and Conditioning Research, 27(4), 978–981. View
Minick, K. I., Kiesel, K. B., & Burton, L. (2010). Interrater reliability of the Functional Movement Screen. Journal of Strength and Conditioning Research, 24(2), 479-86. View
Onate, J. A., Dewey, T., Kollock, R. O., Thomas, K. S., Van Lunen, B. L., DeMaio, M., & Ringer, S. I. (2012). Real time intersession and interrater reliability of the Functional Movement Screen. Journal of Strength and Conditioning Research, 26(2), 408-415. View
Smith, C. A., Chimera, N. J., Wright, N. J., & Warren, M. (2013). Interrater and intrarater reliability of the Functional Movement Screen. Journal of Strength and Conditioning Research, 27, 982-987. View
Elias, J. E. (2015). The inter-rater reliability of the Functional Movement Screen within an athletic population using untrained raters. Journal of Strength and Conditioning Research, (Publish Ahead of Print). View
Shultz, R., Anderson, S. C., Matheson, G. O., Marcello, B., & Besier, T. (2013). Test-retest and interrater reliability of the Functional Movement Screen. Journal of Athletic Training, 48,331-336. View
Cook, G., Burton, L., Kiesel, K. B., Rose, G., & Bryant, M. F. (2011). The Functional Movement Screen: Home study course manual. Aptos, CA: On Target Publications.
Teyhen, D. S., Shaffer, S. W., Lorenson, C. L., Halfpap, J. P., Donofry, D. F., Walker, M. J., Dugan, J. L., & Childs, J. D. (2012). The Functional Movement Screen: A reliability study. Journal of Orthopedic Sports Physical Therapy, 42, 530-540. View
Kazman, J. B., Galecki, J. M., Lisman, P., Deuster, P. A., & O’Connor, F. G. (2014). Factor structure of the Functional Movement Screen in Marine officer candidates. Journal of Strength and Conditioning Research, 28(3), 672-678. View
Lockie, R. G., Schultz, A. B., Jordan, C. A., Callaghan, S. J., Jeffriess, M.D., & Luczo, T. M. (2015). Can selected Functional Movement Screen assessments be used to identify movement deficiencies that could affect multidirectional speed and jump performance? Journal of Strength and Conditioning Research, 29(1), 195-205. View
Sprague, P. A., Mokha, G. M., & Gatens, D. R. (2014). Changes in Functional Movement Screen scores over a season in collegiate soccer and volleyball athletes. Journal of Strength and Conditioning Research, 28(11), 3155–3163. View
Teyhen, D. S., Shaffer, S. W., Lorenson, C. L., Greenberg, M. D., Rogers, S. M., Koreerat, C. M.,… Childs, J. C. (2014). Clinical measures associated with dynamic balance and functional movement. Journal of Strength and Conditioning Research, 28(5), 1272-1283. View
Bodden, J. G., Needham, R. A., & Chockalingam, N. (2015). The effect of an intervention program on Functional Movement Screen test scores in mixed martial arts athletes. Journal of Strength and Conditioning Research, Post Acceptance, July 15, 2013. View
Okada, T., Huxel, K. C., & Nesser, T. W. (2011). Relationship between core stability, functional movement, and performance. Journal of Strength and Conditioning Research, 25(1), 252-261. View
Loudon, J. K., Parkerson-Mitchell, A. J., Hildebrand, L. D., & Teague, C. (2014). Functional Movement Screen scores in a group of running athletes. Journal of Strength and Conditioning Research, 28(4), 909-913. View
Moreside, J. M., & McGill, S. M. (2013). Improvements in hip flexibility do not transfer to mobility in functional movement patterns. Journal of Strength and Conditioning Research, 27(10), 2635-2643. View
Paszkewicz, J. R., McCarthy, C. W., & Van Lunen, B. L. (2013). Comparison of functional and static evaluation tools among adolescent athletes. Journal of Strength and Conditioning Research, 27(10), 2842-2850. View
Wells, J. C. K. & Fewtrell, M. S. (2006). Measuring body composition. Archives of Disease inChildhood, 91, 612-617. View
Nye, N. S., Carnahan, D. H., Jackson, J. C., Covey, C. J., Zarzabal, L. A., Chao, S. Y., …Crawford, P. F. (2014). Abdominal circumference is superior to body mass index inestimating musculoskeletal injury risk. Medicine and Science in Sports and Exercise, 46(10), 1951-1959. View
Russell, A. R., Esco, M. R., Lizana, S. N., Williford, H. N., Olson, M. S., & Kin, H. (2011). The accuracy of a BMI-based equation in predicting percent body fat in college-age female athletes. Journal of Strength and Conditioning Research, 25(1), S35. View
Joshi, P., Bryan, C., & Howat, H. (2012). Relationship of body mass index and fitness levels among schoolchildren. Journal of Strength and Conditioning Research, 26(4), 1006-1014. View
Flegal, K. M., Carroll, M. D., Kuczmarski, R. J., & Johnson, C. L. (1998). Overweight and obesity in the United States: Prevalence and trends, 1960-1994. International Journal of Obesity, 22, 39-47. View
World Health Organization. (2004). International classification of adult underweight, overweight and obesity according to BMI. Retrieved from http://apps.who.int/bmi/index.jsp View
Perry, P. T. & Koehle, M. S. (2013). Normative data for the Functional Movement Screen in middle-aged adults. Journal of Strength and Conditioning Research, 27(2), 458–462. View
Thomas, J. R., Nelson, J. K., & Thomas, K. T. (1999). A generalized rank-order method for nonparametric analysis of data from exercise science: a tutorial. Research Quarterly for Exercise and Sport, 70(1), 11-23. View
Schneiders, A. G., Davidson, A. Horman, E., & Sullivan, S. J. (2011). Functional Movement Screen normative values in a young, active population. International Journal of Sports Physical Therapy, 6(2), 75-82. View
Karras, G., (1997). On the Optimal Government Size in Europe: Theory and Empirical Evidence. The manchester School. 65(3). View