
- About the Journal
- Editorial Board
- Review Process
- Author Guidelines
- Article Processing Charges
- Special Issues
- Current Issue
- Past Issue
 Journal of Rehabilitation Practices and Research
Journal of Rehabilitation Practices and Research Volume 6 (2025), Article ID: JRPR-156
https://doi.org/10.33790/jrpr1100156Research Article
Functional Network Resilience: An Indicator for Classifying Schizophrenia and Bipolar Disorder
Yen-Ling Chen1, Ya-Mei Bai2,3, and Yu-Te Wu4,5*
1 Department of Occupational Therapy, I-Shou University, Kaohsiung, Taiwan.
2 Department of Psychiatry, Taipei Veterans General Hospital, Taipei, Taiwan.
3 Division of Psychiatry, Faculty of Medicine, National Yang Ming Chiao Tung University, Taipei, Taiwan.
4 Institute of Biophotonics, National Yang Ming Chiao Tung University, Taipei, Taiwan.
5 Brain Research Center, National Yang Ming Chiao Tung University, Taipei, Taiwan.
Corresponding Author Details: Yu-Te Wu, Ph.D, Professor, Brain Research Center, National Yang Ming Chiao Tung University, Taipei, Taiwan.
Received date: 31st December, 2024
Accepted date: 27th January, 2025
Published date: 29th January, 2025
Citation: Chen, Y. L., Bai, Y. M., & Wu, Y. T., (2025). Functional Network Resilience: An Indicator for Classifying Schizophrenia and Bipolar Disorder. J Rehab Pract Res, 6(1):156.
Copyright: ©2025, This is an open-access article distributed under the terms of the Creative Commons Attribution License 4.0, which permits unrestricted use, distribution, and reproduction in any medium, provided the original author and source are credited.
Abstract
Schizophrenia and bipolar disorder are difficult to differentiate without multiple clinical visits. Few studies have achieved successful differentiation. To accurately classify these two disorders, the present study used network resilience to generate features because of its ability to reflect the topology of a functional network. We recruited 56 patients with schizophrenia, 51 patients with bipolar disorder, and 50 healthy controls who were separated into training and testing sets. To compare the classification performance of network resilience, we used intra- and inter-network connectivity by computing the correlation of the same or different networks, decomposed through independent component analysis. Results indicated that the classification performance of network resilience outperformed that of network connectivity (accuracy: 0.81 > 0.63 for the training set; 0.80 > 0.31 for the testing set). The network resilience of schizophrenia had a closer similarity to a random network, because schizophrenia demonstrates disruption in central hubs, which are regions with many connections. The superior classification performance of network resilience may be the result of more pervasive dysconnectivity and more disrupted hub connectivity in schizophrenia than in bipolar disorder. Moreover, large variations in schizophrenia may inhibit the classification performance of network connectivity. Therefore, network resilience can be a compelling marker for differentiating the neuropsychiatric disorders of schizophrenia and bipolar disorder.
Keywords: Classification, Schizophrenia, Bipolar Disorder, Network Resilience, Hubs, Machine Learning.
Introduction
Schizophrenia (SZ) and bipolar disorder (BD) are two common neuropsychiatric disorders. SZ is a psychotic disorder characterized by extensive impairments in thought, attention, affect, and motor performance [1-3]. The diverse symptoms of SZ can result from aberrant interactions or the integration of distributed brain regions; therefore, SZ is also regarded as a misconnection syndrome [2]. BD is characterized by episodic fluctuations in mood when the activity and connectivity of brain regions that mediate emotional regulation are disrupted [4-6]. These two neuropsychiatric disorders have been found to have distinguishable and multifaceted abnormalities [7]. However, differentiating between SZ and BDis difficult without multiple clinical visits [8] because they share apparent clinical symptoms, genetic risk mechanisms, and neurocognitive dysfunction [9].
To distinguish SZ from BD, the resilience of brain networks may be a potential marker. Resilience analysis has been used to measure the robustness of the effects of brain lesions by using simulated attacks. This analysis is conducted by removing regions and their connections according to specific targeted properties [10-13]. Random networks, in which the majority of nodes have a similar number of connections, are highly resilient to damage. However, brain networks (small-world networks) are more vulnerable in scant brain regions with many connections, which are referred to as hubs. Hence, the architecture of small-world networks fragments rapidly in response to damage [10,14,15]. Because resilience analysis can reflect the architecture of the human brain network, it has also been used in research into neuropsychiatric diseases and aging [16-19]. Lo et al. [17] found that the global efficiency of patients with SZ and their siblings was degraded more severely by targeted attacks than was that of healthy control (HC) subjects, indicating that topological abnormalities of functional networks were evident not only in patients with SZ but also in their nonpsychotic relatives. Targeted attacks on connectivity hubs were especially likely to degrade global properties of small-world networks, such as global efficiency. Therefore, in the present study, we targeted betweenness centrality for measuring hub connectivity and global efficiency as a response to attacks.
Because the organization of hub connectivity has been found to be we hypothesized that resilience analysis provides a novel approach more aberrant in patients with SZ than in those with BD [13,21,22], to classify these two highly similar neuropsychiatric disorders. Furthermore, we hypothesized that resilience analysis has the potential to be a robust and reliable differentiation tool for diagnosis. The aim of this study was to explore whether differences in the global characteristics of brain functional networks between SZ and BD can be used in diagnosis using resilience analysis.
Materials and Methods
Participants
A total of 56 patients with SZ, 51 patients with BD type I, and 50 HCs were recruited. The SZ and BD groups included both outpatients and inpatients at Taipei Veterans General Hospital, Taiwan. Patients’ diagnoses were confirmed according to the Diagnostic and Statistical Manual of Mental Disorders, Fifth Edition on the basis of structured clinical interviews. The Positive and Negative Syndrome Scale (PANSS) was used to measure patients’ symptom severity [23]. Approximately 57% of patients with BD had been classified as psychotic during one or more illness episodes. Potential participants were excluded if they had substance abuse history or dependence during the previous 6 months or history of head injuries with documented sustained loss of consciousness, neurological sequelae, or both. The investigation was conducted according to the latest version of the Declaration of Helsinki. All participants provided written informed consent prior to their participation and after the procedures had been fully explained. The present study was approved by the Research Ethics Committee of Taipei Veterans General Hospital.
Resting-State Functional and Structural Magnetic Resonance Imaging
Scanning was conducted at the Taipei Veterans General Hospital by using a 3.0-T GE magnetic resonance imaging (MRI) scanner (GE Healthcare Life Sciences, Little Chalfont, UK) with a quadrature head coil. Subjects’ heads were immobilized with a vacuum-beam pad inside the scanner. All participants wore earplugs to muffle the noise. Resting-state functional images were obtained using a T2*- weighted gradient-echo, echo-planar sequence (repetition time [TR] = 2500 ms, echo time [TE] = 30 ms, flip angle [FA] = 90 degrees, and voxel size = 3.5 × 3.5 × 3.5 mm). A total of 200 MRI volumes of each subject were obtained with their eyes closed. A functional whole-brain image volume was composed of 43 interleaved horizontal slices, which were parallel to the intercommissural plane. Furthermore, anatomical whole-brain image volumes were obtained using a sagittal magnetization-prepared rapid acquisition gradient echo three-dimensional T1-weighted sequence (TR = 2530 ms, TE = 3 ms, echo spacing = 7.25 ms, FA = 7 degrees, field of view = 256 × 256 mm, voxel size = 1 × 1 × 1 mm) for more efficient spatial registration and localization of activity, as well as to further correct for anatomical differences that might affect the interpretation of the functional analysis.
Preprocessing for Resting-State Functional MRI
Imaging data were preprocessed using DPABI (http://rfmri.org/ DPABI) according to the following steps: (1) slice-dependent time shifts were compensated for; (2) the initial eight volumes were excluded; (3) head motion was corrected for and participants with head motion larger than 3 mm or 3° were discarded; (4) functional imaging volumes were coregistered with their own anatomical images; (5) spatial normalization into the Montreal Neurological Institute space was performed using a nonlinear warping algorithm; and (6) smoothing was conducted using a 6-mm full-width half-maximum Gaussian kernel. After smoothing, spurious data were removed using a regression model containing the six parameters obtained using rigid-body affine transformation during preprocessing, the mean whole-brain signal, the mean signal from the lateral ventricles, and the mean signal within a deep-white-matter region of interest. Subsequently, band-pass filtering from 0.01 to 0.08 Hz was applied to the imaging data.
Functional Connectivity Analysis
Functional connectivity was conducted by parcellating the whole brain into 116 regions according to the automatic anatomical labeling template [24]; this template is widely used and demonstrates small-world topology and resilience [10]. The correlation between each pair of regional time series of the 116 regions was examined using Pearson’s correlation coefficient and then converted using Fisher’s r-to-z transformation [25]. Consequently, functional networks for each patient were obtained as a 116 × 116 normalized, symmetric correlation matrices. The absolute values of correlation matrix elements were analyzed using one-sample t-tests, and values less than the lower bound of the 99.9% confidence interval (CI) were removed. The threshold was based on individual significance levels for discarding spurious connections [26,27]. Subsequently, a binary adjacency matrix was generated by converting the remaining absolute z-values to 1 and the others (including diagonal elements) to 0. Graph theory and resilience analyses were performed on these nonzero, binary adjacency matrices.
Graph Theory and Resilience Analyses
The topological properties of brain networks were quantified using a theoretical graph analysis, which uses a graph to provide an abstract representation of a small-world system’s elements and their interactions [28]. The small-world topology and hierarchy of brain networks were evaluated by calculating the small-worldness and betweenness centrality, respectively. Compared with an Erdös–Rényi random network, the clustering coefficient of a small-world network is higher but their characteristic path lengths are nearly equal. The characteristic path length (L)refers to the minimum number of connections between one region of the brain and another. The clustering coefficient (Cl) quantifies the proportion of connections that exist between the neighbors nearest to a brain region and was obtained as follows:
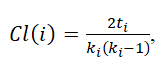
Equation
where ki is the number of connections between node i and other nodes and ti is the number of triangles attached to node i. Subsequently, the value of small-worldness (sw) was calculated using
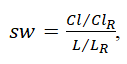
Equation
where ClR and LR are the clustering coefficient and characteristic path length of the random network, respectively. Betweenness centrality is a measure of the number of shortest paths between all other node pairs in the network passing through it. Brain regions with high centrality are crucial for efficient communication. To compute the betweenness centrality of a node i, the proportion of the shortest paths between nodes j and h that pass through I were obtained using
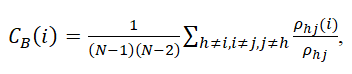
Equation
where ρhj(i) is the number of the shortest paths between nodes j and h that pass through I;ρhj is the number of the shortest paths between j and h; and (N−1)(N−2) is the number of node pairs that does not include node i. Furthermore, for further resilience analysis, global efficiency, which is the reciprocal of the average of the shortest path length between all possible pairs of nodes, was calculated to measure the integration and efficiency of the global network.
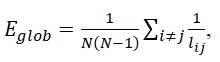
Equation
where lij is the shortest path length from node j to node i. The values of small-worldness and global efficiency in the three groups were also compared using one-way ANOVA.
To assess the resilience of a brain network, we used betweenness centrality as the target for a targeted attack by deleting one brain region at a time in descending order of betweenness centrality. After each brain region was deleted, the global efficiency of residual brain regions was divided by the global efficiency of the original brain network prior to the attack to compute the normalized global efficiency. The process was repeated until only the last cluster in the residual network remained. In addition, targeted elimination of nodes in the random network with the same mean connection density was computed for comparison.
Independent Component Analysis
Next, a group-level temporal concatenation independent component analysis (group ICA) was performed from the preprocessed imaging data of the HC group to extract group representative large-scale networks by implementing FSL’s Multivariate Exploratory Linear Optimized Decomposition into Components (https://fsl.fmrib. ox.ac.uk/fsl/fslwiki/MELODIC) version 3.0. Such brain network decompositions allow for a simultaneous separation into spatially and maximally independent resting-state networks for the whole brain. The 75 independent components (ICs) were decomposed because the high-order ICA has been demonstrated to correspond to known anatomical and functional segmentations [29,30]. The ICs were created to allow for the adequate modeling of both resting-state networks and artifacts, including noise and physiological signals [31]. A threshold level of 0.5 was set for IC maps. To extract putative intrinsic networks (INs), ICs were evaluated by detecting peak activations in the gray matter; a low spatial overlap with known vascular, ventricular, motion, and susceptibility artifacts; and time courses dominated by low-frequency fluctuations [32,33]. Each IN was classified according to relevant studies [33-36]. Subsequently, regression-based back-reconstruction was performed to produce specific time courses of each subject’s intrinsic functional brain network. Next, the intra- and inter-network connectivity were calculated through a cross-correlation between the time courses of pairwise components by using Pearson’s correlation coefficient. Fisher’s r-to-z transformation was used to normalize correlation coefficients into z-scores. Furthermore, the average network connectivity between and within specific networks and differences among the three groups were computed. In addition, to better realize the effect of resilience analysis, graph theory and resilience analysis was also implemented on the connectivity of intrinsic networks, referring to as the resilience of gICA network connectivity.
Classifier Selection and Feature Extraction for the Classification
The present study evaluated the classification performance of the classifier for network resilience as well as for the intra- and inter-network connectivity. We used several well-known linear and nonlinear classifiers, including the decision tree [37], support vector machine (SVM) [38], k-nearest neighbor (KNN) [39], and ensemble [40] models. All the classifiers used MATLAB (version 2017b; Math Works, Inc., Natick, MA, USA). This study separately used the classifiers with the greatest accuracy for features extracted from resilience and network connectivity.
The participants in each group were randomly separated into a training set and a testing set. Each training set consisted of approximately two-thirds of each group (38 participants in the SZ group, 34 in the BD group, and 34 in the HC group). To balance the number of features extracted from resilience and network connectivity, we selected consistent and reliable features of network connectivity by using minimum-redundancy maximum-relevance (mRMR) feature selection from the three groups [41]. The first 115 reliable intra- and inter-network connectivities were chosen for the classifier. The resilience and the network connectivity were separately used to train the classifiers by ten-fold cross-validation. Moreover, in repeated cross-validations, the model from resilience and from network connectivity were each retrained 100 times with randomly selected training samples for each group to ensure the robustness of the trained model. The testing sample included the remainder of the participants (18in the SZ group, 17 in the BD group, and 16 in the HC group). The accuracies, sensitivities, and specificities of the training and testing samples of the most optimal trained model were used to compare the classification performance of these two types of feature. The process of feature extraction and classifier selection for the classification is showed in Figure 1.
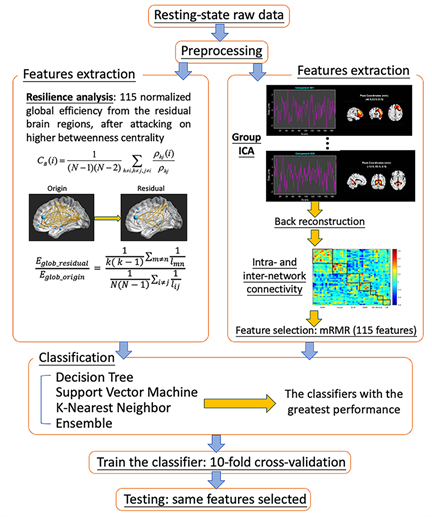
Figure 1. Overview of the classification process. After preprocessing resting-state functional magnetic imaging data, two approaches to feature extraction were used: group independent component analysis (ICA) and resilience analysis. The resting-state data of healthy controls were decomposed into 75 components; then, the back-reconstruction method was used to estimate the spatial maps and time courses of all participants. Time courses of 43 components, which were identified as intrinsic connectivity networks, were used to compute the intra- and inter-network connectivity. Minimum-redundancy maximum-relevance feature selection was used to select 115 features from a total of 903 connections. Then, 115 normalized global efficiencies were classified after targeted elimination, and 115 intra- and inter-network connections were trained separately to select the optimal classifier.
Statistical Analyses
Differences across the SZ, BD, and HC groups in terms of network resilience after each targeted attack and intra- and inter-network connectivity were assessed using one-way analysis of variance (ANOVA) with multiple comparisons corrected for and the false discovery rate (FDR) correction (q< 0.05) applied [42]; subsequently, Bonferroni post-hoc tests were also used [43].
Results
According to the demographic data, no significant differences existed in terms of age or sex across the three groups as well as in terms of age at onset between the two patient groups (Table 1). However, significant differences were observed in terms of duration, which could be the result of only patients with SZ being those in a stable phase. The total PANSS scores were significantly different between the SZ and BD groups (including 29 patients who had psychosis). Furthermore, the three groups did not differ significantly in terms of mean response time in the 1-back working memory test but differed significantly in terms of correct number in the same test as well as in mean response time and correct number in the 2-back working memory test (p<0.05). Pairwise differences were investigated using Bonferroni post-hoc analysis, and results showed that significant differences existed between the SZ and HC groups as well as between the BD and HC groups. This indicated that both the SZ and BD groups had poorer working memory than did the HC group, especially in the more difficult task; however, the two patient groups showed no significant difference.
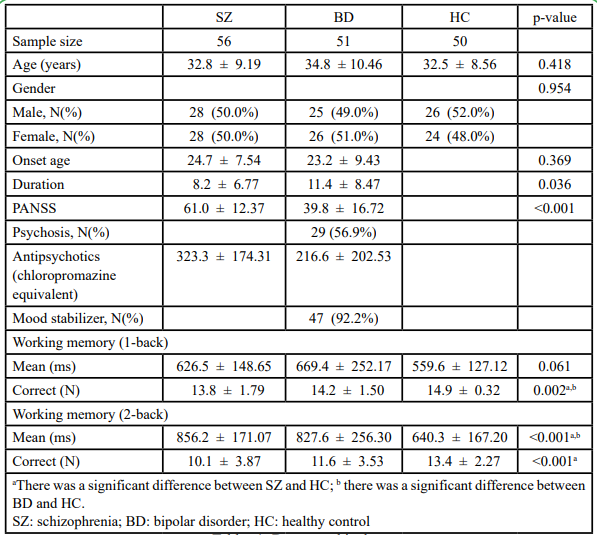
Tables 1: Demographic data
Features from the Resilience Analysis
For each participant, 115 values existed for normalized global efficiency until the last cluster remained. These 115 values were then used as features to train the classification model for the resilience analysis.
Features from Intra- and Inter-Network Connectivity
After artifactual ICs were removed, 43 components remained, which generated 903 connections of pairwise components. As Figure 2 shows, these networks were classified into the somatomotor network (SMN), visual network, executive network (ECN), default mode network (DMN), salience network (SN), auditory network (AN), subcortical regions (SUB), and cerebellum (CB). Based on the network that each component belonged to, the intra- and inter-network connectivity in each of the three groups were estimated, and 115 connections were selected among the 903 connections using mRMR.
Classification Performance
Because there are individual variations in the network properties within each group, we adopted the group order of betweenness centrality and removed the nodes one by one to re-compute the global efficiency as features. The same order was applied for testing samples too. The most optimal model was determined to be the ensemble model (subspace discriminant) for both resilience and network connectivity. As shown in Table 2, both overall accuracies [95% CIs] for classifying the training and testing samples on features extracted using resilience analysis (81.13% [88.58%, 73.68%] and 80.39% [91.29%, 69.49%]) were higher than those extracted using intra and inter-network connectivity (63.21% [72.39%, 54.03%] and 31.37% [44.10%, 18.64%]). The p-values of the proportion test for training and testing accuracies from the two feature extraction approaches were 0.004 and <0.001, respectively, indicating a significant difference between resilience and network connectivity features. The sensitivities, specificities, and areas under the ROC curve (AUCs) for the model of resilience were all superior to that of network connectivity (Table 2 and Figure 3). Both the AUCs for the models from resilience and network connectivity were as follows: HC > SZ > BD. In addition, the classification performance of resilience was also compared with functional connectivity in which the respective features derived from the same parcellation, namely, AAL. The initial features for the functional connectivity derived from AAL parcellation were 6670 connections in total, which were in turn selected by mRMR and reduced to 115 connections. The classification results of using functional connectivity as features showed that the overall accuracies [95% CIs] for classifying the training and testing samples were 61.32% [70.59%, 52.05%] and 29.41% [41.92%, 16.91%], respectively (Table 2). The p-values of the proportion test were 0.001 and <0.001 for training and testing samples, respectively. Therefore, even using the same parcellation, the classification performance of resilience was still superior to that of functional connectivity. Moreover, Table 3 indicated the classification performance with the features extracted from the resilience and connectivity of intrinsic networks with the same number of features. For the training samples, the results exhibited that the overall accuracies [95% confidence intervals] for resilience and network connectivity were 53.77% [63.27%, 44.28%] and 66.04% [75.05%, 57.02%], respectively; for the testing samples, were 37.25% [50.52%, 23.99%] and 35.29% [48.41%, 22.18%], respectively. The p-values of proportion test for the training and testing samples were 0.068 and 0.837, respectively. Accordingly, the difference between the classification performance of resilience and that of network connectivity was insignificant. In addition, Table 4 demonstrated the average of means and standard deviations of all features for the classification. All types of features except the resilience of AAL- based functional connectivity had high standard deviation.
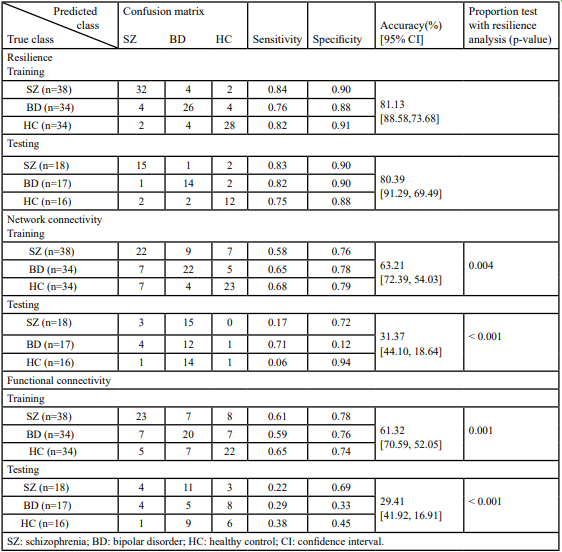
Tables 2: Ensemble (subspace discriminant) classification of resilience analysis, intra- and inter-network connectivity using independent component analysis (ICA), and functional connectivity measured by AAL parcellation
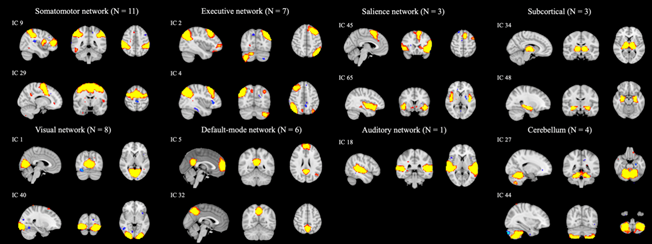
Figure 2. Thresholded spatial maps of 43 intrinsic connectivity networks were classified into eight networks. Each network is exemplified by one or two components.
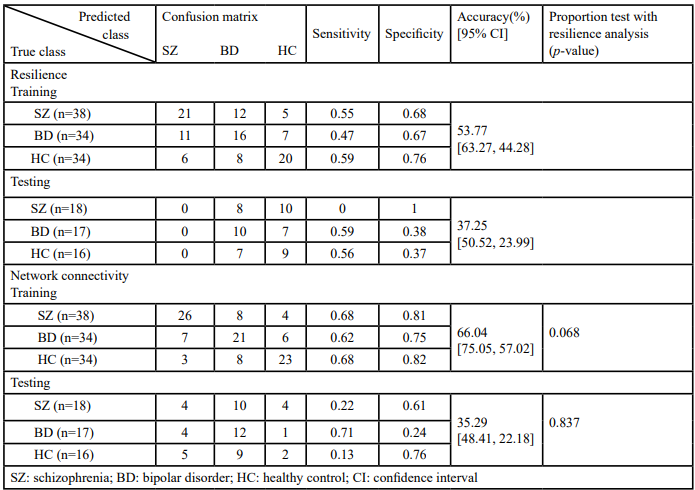
Table 3. Ensemble (subspace discriminant) classification of resilience analysis, and intra- and inter-network connectivity both by using group independent component analysis (gICA)
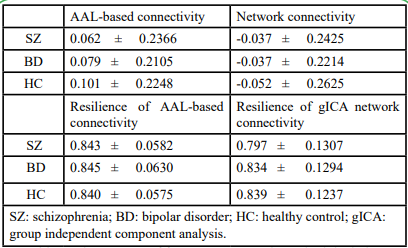
Tables 4: The average of features’ mean and standard deviation
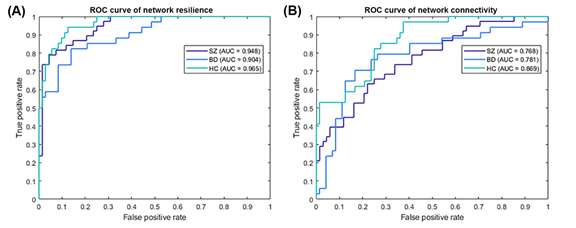
Figure 3. ROC curve of the trained classifier using (A) network resilience and (B) network connectivity for schizophrenia (purple line), bipolar disorder (blue line), and healthy controls (cyan line) as the positive class. The ensemble model was the most optimal for both the 115 values of normalized global efficiency using resilience analysis and the 115 values of intra and inter-network connectivity using independent component analysis. The classification performance for the features from network resilience provided higher sensitivity, specificity (> 0.7), and areas under the curve (> 0.9) for all three groups than that for the features from network connectivity.
Network Robustness Comparisons from the Resilience Estimation
The mean absolute errors between network resilience curves of SZ, BD, HC (Figure 4A) and that of Erdös–Rényi random network were 0.0417, 0.0431, and 0.0498, respectively. Hence, compared with the BD and HC groups, the result of an attack on patients with SZ was more robust and more similar to the performance of random networks, which suggests a closer similarity between a random network and the topology of the brain network in SZ. As the red asterisks indicate in Figure 4, the normalized global efficiency with 88.8%, 94.0%, and 94.8% targeted elimination of nodes was significantly different across the three groups with FDR correction (q< 0.05). According to the results of the post-hoc test, the elimination of SZ was significantly higher than that of the other groups at 88.8% and that of BD was significantly lower than those of the other groups with 94.0% and 94.8% eliminations. After network attacked, the connection of the remaining cluster of brain regions was more highly clustered in SZ group than the other two groups (Figure 4B). Hence, the network of SZ group remained high efficiency. The clustering coefficients of SZ, BD, HC groups were 0.63, 0.55, 0.55, respectively, in the 88.8% attacked network, were 0.64, 0.40, 0.56, respectively, in the 94.0% attacked network, and were 0.48, 0.45, 0.39, respectively, in the 94.8% attacked network.
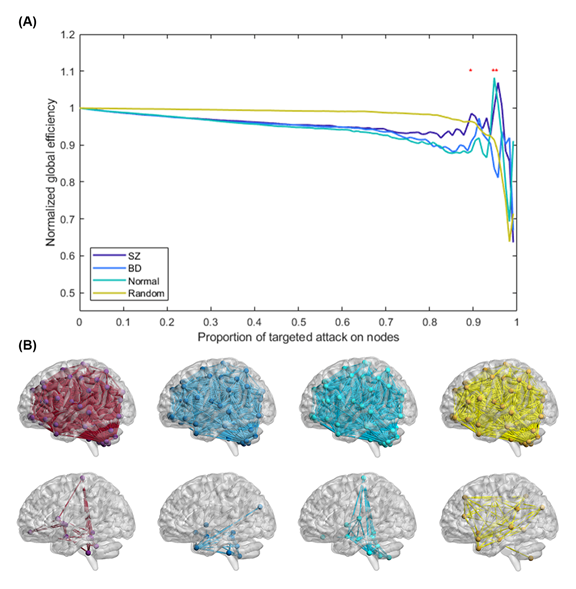
Figure 4. Network resilience of schizophrenia (SZ; purple line), bipolar disorder (BD; blue line), healthy control (HC; green line), and Erdös–Rényi random network (yellow line). (A) The normalized global efficiency of each group changed with increasing proportions of targeted elimination on nodes. During the targeted attack, the brain regions were eliminated in descending order of betweenness centrality, one region at a time. Once an additional region was eliminated, the normalized global efficiency of all the networks was recalculated. The normalized global efficiency was computed by dividing the global efficiency of the residual network by the global efficiency of the unattacked network. Red asterisks indicate significant differences in normalized global efficiency between the three groups using analysis of variance with false discovery rate correction (q< 0.05). (B) The glass brain illustrates the connectivity after eliminating 88.8% of nodes in the networks of SZ, BD, and HC, and the random network.
Estimation of Brain Network Properties
Regarding the results of the network property analysis, after thresholding, the average connection densities of the SZ, BD, and HC groups were all 0.41. Hence, the number of vertices and edges of the simulated Erdös–Rényi random network were set to 116 and 23, respectively, generating adjacency matrices with connection densities of 0.40. As Figure 5 shows, both the values of small worldness (SW) and global efficiency (GE) were not significantly different between the three groups (FSW(2,154) = 1.95, p-value = 0.145; FGE(2,154) = 0.70, p-value = 0.499). The functional networks of all three groups exhibited small-world topologies because the clustering coefficients of the three groups were larger than matched random networks; furthermore, the characteristic path lengths of all groups were identical to random networks. The mean (standard deviation) small-worldness in the SZ, BD, and HC groups were 1.33 (0.044), 1.31 (0.038), and 1.33 (0.043), respectively.
The betweenness centrality of every single 116 regions according to the automatic anatomical labeling template was compared across SZ, BD, and HC. There was no significant difference after FDR (q< 0.05) correction. Table 5 demonstrates differences in betweenness centrality with uncorrected p-value. In the Bonferroni post-hoc test, aberrant betweenness centrality compared with HCs in the right Rolandic operculum was in both SZ and BD. In addition, compared with HCs, patients with SZ exhibited abnormal centrality in the frontal operculum, superior occipital gyrus and cerebellar lobule 8. Patients with BD exhibited abnormal centrality in cerebellar lobules IV, V and cerebellar lobule VIIB. Patients with SZ and BD showed different centralities in the frontal operculum and precuneus.
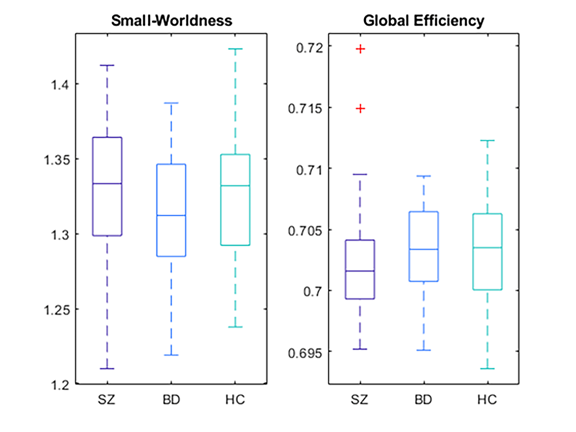
Figure 5. Boxplot of the small-worldness and global efficiency of the three groups, which were used to show global patterns of network topology. Both of these properties exhibited no significant differences between the three groups (p> 0.05). SZ: schizophrenia; BD: bipolar disorder; HC: healthy control.
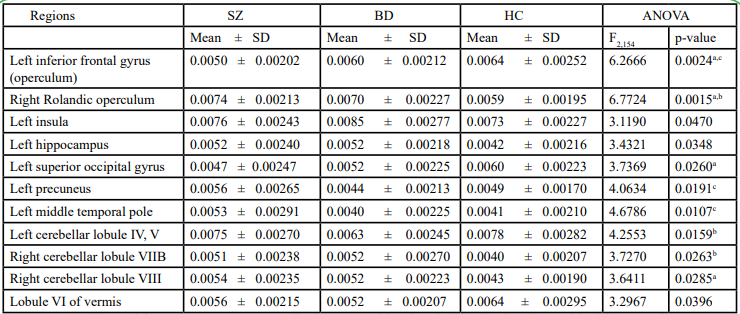
Table 5. Different betweenness centrality between schizophrenia, bipolar disorder, and healthy control
Network Connectivity Comparisons
As Figure 6 shows, among the 903 intra- and inter-network connections, the SZ and HC groups were significantly different with more altered connections than did the BD and HC groups. Additionally, as Table 6 shows, from the 35 mean correlations between and within eight networks (excluding the intra-network connectivity of AN, which consisted only one component), the mean correlation between SMN and ECN (SZ < BD < HC), ECN and DMN (SZ > BD > HC), AN and cerebellum (SZ > HC > BD), subcortical regions and cerebellum (SZ < BD < HC), and within subcortical regions (SZ > BD > HC) were significantly different after ANOVA with FDR (q< 0.05) correction. Greater aberration of themean correlation was in SZ than in BD. The results of the Bonferroni post-hoc test indicated that significant differences existed between SZ and HC in SMN-ECN, ECN-DMN, and AN-cerebellum network connectivity, as well as between SZ and BD in terms of AN-cerebellum network connectivity.
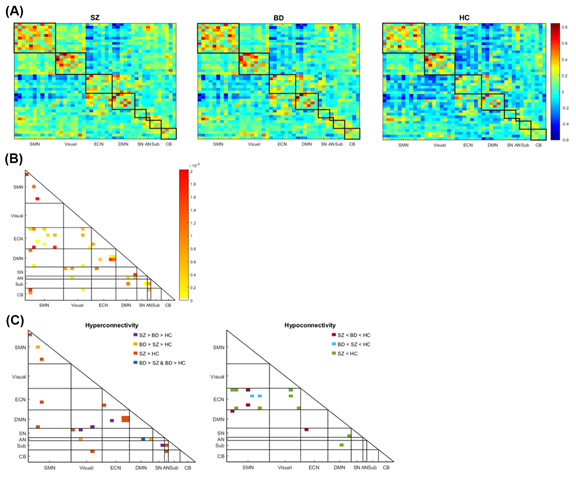
Figure 6. The connectivity within and between the somatomotor network (SMN), visual network (Visual), executive network (ECN), default-mode network (DMN), salience network (SN), auditory network (AN), subcortical regions (Sub), and cerebellum (CB). (A) The intra- and inter-network connectivity of the three groups; the color bar represents the z-score of the correlation. (B) The connections differed between the three groups according to an analysis of variance corrected by false discovery rate (q< 0.05); the color bar represents the intensity of the p-value. (C) Left: The connections with significantly increased connectivity in the patient groups compared with the control group using Bonferroni post-hoc test. The altered connections of SZ are located in DMN-ECN, DMN-SMN, AN-cerebellum, and visual-cerebellum, and those of BD are located in SN-visual, AN-visual, DMN-ECN, and DMN-visual. In addition, hyperconnectivity within the network is exhibited in SMN with SZ > HC and SZ > BD > HC, as well as in ECN with SZ > HC. Right: The connections with significantly decreased connectivity in the patient groups compared with in the control group using Bonferroni post-hoc test. The altered connections of SZ are located in SN-DMN, SN-ECN, and ECN-SMN, and those of BD are located in SMN-DMN, SN-ECN, and ECN-SMN.
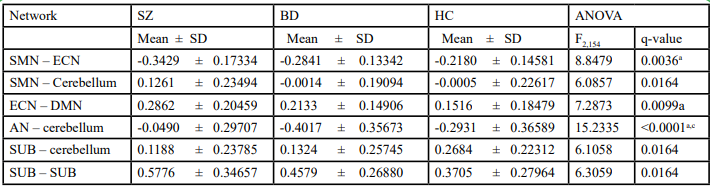
Table 6. Different mean network connectivity between schizophrenia, bipolar disorder, and healthy control
Discussion
We demonstrated that region-based network resilience can be a powerful marker for classifying SZ and BD, two similar psychiatric disorders. The region-based network robustness of the SZ group and the random network were more similar than that of the BD and HC groups, which indicated more disrupted hub connectivity in SZ. Furthermore, patients with SZ showed more pervasive dysconnectivity than did patients with BD. Widespread dysconnectivity and aberrant hub connectivity may lead to the successful classification of these two neuropsychiatric disorders using global features rather than local properties, namely the functional connectivity of specific brain regions or networks. Thus, region-based network resilience outperformed intra- and inter-network connectivity and AAL-based functional connectivity in classifying the two disorders and HCs.
Brain Network Resilience as a Potential Indicator for Classifying SZ and BD
Region-based network resilience reflected the topology of the brain network, and as relevant studies have demonstrated, the brain network of SZ and random network showed closer similarity in network resilience [17]. When we simulated a targeted attack on brain regions in the descending order of betweenness centrality through resilience analysis, removing nodes caused brain networks to become more fragmented if there was apparent hub connectivity in the networks. Because the topology of hub connectivity is more disrupted in SZ than in BD, resilience analysis could be used as a tool with great accuracy, high sensitivities (0.83 in SZ and 0.82 in BD) and specificities (0.90 in SZ and 0.90 in BD) for differentiating SZ from BD.
The significantly reduced connectivity of central hubs in patients with SZ have been found to imply a reorganization of network topology [20,21]; however, BD has been shown to involveless disruption in hub connectivity [22,44]. Both SZ and BD exhibited altered segregation and integration [45]; however, the degree of randomization was also higher in SZ than in BD [46]. Brain network organization in SZ was typically found to be less dominated by hubs and less hierarchically connected because of the topological decentralization of affected hubs. The structural and functional abnormalities in patients with SZ were preferentially located in hubs [20,21]. The results of the present study demonstrated significantly increased centrality in the left frontal operculum and decreased centrality in the right Rolandic operculum in SZ compared with the other two groups. Alterations in these two main subdivisions of the insular-opercular system supported the correlation with chronic hallucinations in SZ or nonclinical psychosis [47], which may result from the role of the frontal operculum in internal speech and the role of the Rolandic operculum in sensory-auditory integration [48,49].
Superior Classification Performance Using Global Properties
Altered global connectivity is more characteristic of SZ. The dysconnectivity of neuropsychiatric disorders suggests that psychotic illnesses result not from regionally specific focal pathophysiology in the brain but rather from abnormal integration between neuroanatomical regions [50]. When the focus was on the dysconnectivity of focal brain regions, classification was inferior because patients might have shown widespread contributions and lacked marked regions [51]. The lower classification performance of network connectivity and AAL-based functional connectivity features may have resulted from both overlapping and distinctive connectivity across SZ and BD being found. The aberrant centrality in SZ and BD was found in distinct brain regions as well as in diverse networks. Thus, although dysconnectivity was not as prominent in the BD group as it was in the SZ group, which was consistent with previous studies [9,52], network connectivity was unsuitable for differentiating the two disorders.
Moreover, previous studies also showed inconsistent results in distinguishing abnormalities between SZ and BD. Patients with BD have exhibited it in meso- and para-limbic regions, which was more focal than in SZ [53]; patients with SZ have exhibited pervasive dysconnectivity of structural and functional connectivities [1,3,54-61]. In addition, some studies have indicated that the differentiating marker may be located in sensory regions [44,46]. However, some studies have still indicated that there was no disease-specific network or compensatory region, which could be elucidated by the fact that the two disorders have several common clinical symptoms; there is the continuum of neural abnormalities across the two disorders [44,62]. They have exhibited similar dysfunction in cortico-thalamic circuits [63,64], callosal and frontotemporal circuits [61], and the frontoparietal control network [65]. Skatun et al. [44] also indicated that both patients with SZ and BD showed decreased centrality in limbic structures and increased centrality in frontal and parietal regions.
Brain Network Resilience as a Robust Feature to Heterogeneity of SZ and BD
The network properties within groups showed high heterogeneity, but region-based network resilience can have robust features for classifying SZ and BD. Differences in small-worldness across the three groups were nonsignificant, which may have resulted from heterogeneity (see Figure 5). The lower classification performance of network connectivity and AAL-based functional connectivity features may have also resulted from high individual variations, since that the heterogeneity of neuropsychiatric disorders has been shown in relevant studies [2,20,65,66]. Suo et al. [45] systematically reviewed the brain network architecture of neuropsychiatric disorders by using network properties and reported that studies have shown inconsistent alterations in network topology. In addition, the lower classification performance of resilience computed from gICA network connectivity may result from large individual variations in normalized global efficiency of residual network connectivity after network removal. Consequently, classification using network resilience is superior to that using each network connectivity demonstrated in the present study. The results indicated that the global feature of network robustness was a more compelling feature than was focal functional network connectivity, because the topological information may diminish the influence of individual variations.
Limitations
The present study has some limitations. First, all participants had received antipsychotic treatment for a long time. Long-term treatment with antipsychotic medication was found to affect changes in the brain that may result from the disease. In the present study, there were no significant correlations between disease duration and mean network connectivity or between disease duration and normalized global efficiency. However, it was still difficult to exclude all the effects of treatment. All patients recruited were not naïve. Second, group ICA was conducted for the HC group but not for the HCs who were independent of three-group comparisons. However, intrinsic connectivity networks decomposed in the present study were consistent with those reported in other studies. Third, the static functional connectivity analysis in the present study, which averages over the entire acquisition time, is believed to overlook variable brain activity during the acquisition period [67,68]. However, whether brain network properties are influenced by variations in the acquisition period remains unclear. In the future, we may compare features extracted by static functional connectivity and dynamic functional connectivity.
Conclusion
We proposed a novel approach, resilience, to classify patients with SZ and BD as well as HCs. Classification of the two neuropsychiatric disorders using resilience analysis had higher accuracy for two main reasons. First, resilience analysis provides an approach to detect the topological structure of brain networks. Brain networks have distributions that are more heterogeneous than those of random networks because the topology of hub connectivity plays a crucial role in small-world networks and hierarchical organization. Second, the classification performance by global properties was superior to that by local ones, because patients with SZ and BD have distinct and shared network dysconnectivity and have heterogeneous presentations. The use of global change in brain network organization, such as global efficiency after a targeted attack, may result in more accurate classification than the use of local changes, such as region-to-region functional connectivity. Consequently, network resilience may be a tool for classifying SZ and BD and may help their diagnosis in the future.
Competing Interests:
The authors declare that the research was conducted in the absence of any commercial or financial relationships that could be construed as a potential conflict of interest.
Author Contributions
Yen-Ling Chen conceived of the study, performed the analysis, and wrote the manuscript. Po-Shan Wang contributed to the interpretation of the results and the representation of the figures. Pei-Chi Tu collected the data and conducted the clinical assessments. Tung-Ping Su collected the data and conducted the clinical assessments. Yu-Te Wu supervised the findings of the study and contributed to the interpretation of the results. All authors contributed to the final manuscript.
Funding
This work was supported by the Taipei Veterans General Hospital (V102D-001-2); the National Science Council (NSC103- 2314-B-075-065-MY2); the Ministry of Science and Technology (MOST106-2221-E-010-010-MY2); the National Health Research Institutes (NHRI-EX107-10526EI); and the Veterans General Hospitals and University System of Taiwan Joint Research Program (VGHUST108-G7-1-2). The funders had no role in the study design, data collection, data analysis, data interpretation, writing of the report, or decision to submit the article for publication.
Acknowledgments
We would like to thank the department of radiology for operating the equipment. This manuscript was edited by Wallace Academic Editing.
References
Friston, K.J., and Frith, C.D., (1995). Schizophrenia: a disconnection syndrome? Clin Neurosci 3(2), 89-97. View
Andreasen, N.C. (1999). A unitary model of schizophrenia: Bleuler's "fragmented phrene" as schizencephaly. Arch Gen Psychiatry 56(9), 781-787. View
Liang, M., Zhou, Y., Jiang, T., Liu, Z., Tian, L., Liu, H., et al. (2006). Widespread functional disconnectivity in schizophrenia with resting-state functional magnetic resonance imaging. Neuroreport 17(2), 209-213. View
Leow, A., Ajilore, O., Zhan, L., Arienzo, D., GadElkarim, J., Zhang, A., et al. (2013). Impaired inter-hemispheric integration in bipolar disorder revealed with brain network analyses. Biol Psychiatry 73(2), 183-193. View
Phillips, M.L., and Swartz, H.A. (2014). A critical appraisal of neuroimaging studies of bipolar disorder: toward a new conceptualization of underlying neural circuitry and a road map for future research. Am J Psychiatry 171(8), 829-843. View
Breakspear, M., Roberts, G., Green, M.J., Nguyen, V.T., Frankland, A., Levy, F., et al. (2015). Network dysfunction of emotional and cognitive processes in those at genetic risk of bipolar disorder. Brain 138(Pt 11), 3427-3439. View
Orru, G., Pettersson-Yeo, W., Marquand, A.F., Sartori, G., and Mechelli, A. (2012). Using Support Vector Machine to identify imaging biomarkers of neurological and psychiatric disease: a critical review. Neurosci Biobehav Rev 36(4), 1140-1152. View
Keshavan, M.S., Morris, D.W., Sweeney, J.A., Pearlson, G., Thaker, G., Seidman, L.J., et al. (2011). A dimensional approach to the psychosis spectrum between bipolar disorder and schizophrenia: the Schizo-Bipolar Scale. Schizophr Res 133(1-3), 250-254. View
Kuswanto, C.N., Sum, M.Y., and Sim, K. (2013). Neurocognitive Functioning in Schizophrenia and Bipolar Disorder: Clarifying Concepts of Diagnostic Dichotomy vs. Continuum. Front Psychiatry 4, 162. View
Achard, S., Salvador, R., Whitcher, B., Suckling, J., and Bullmore, E. (2006). A resilient, low-frequency, small-world human brain functional network with highly connected association cortical hubs. J Neurosci 26(1), 63-72. View
Kaiser, M., Martin, R., Andras, P., and Young, M.P. (2007). Simulation of robustness against lesions of cortical networks. Eur J Neurosci 25(10), 3185-3192. View
Alstott, J., Breakspear, M., Hagmann, P., Cammoun, L., and Sporns, O. (2009). Modeling the impact of lesions in the human brain. PLoS Comput Biol 5(6), e1000408. View
Joyce, K.E., Hayasaka, S., and Laurienti, P.J. (2013). The human functional brain network demonstrates structural and dynamical resilience to targeted attack. PLoS Comput Biol 9(1), e1002885. View
Albert, R., Jeong, H., and Barabasi, A.L. (2000). Error and attack tolerance of complex networks. Nature 406(6794), 378- 382. View
Shang, Y. (2016). Localized recovery of complex networks against failure. Sci Rep 6, 30521. doi: 10.1038/srep30521. View
Crossley, N.A., Mechelli, A., Scott, J., Carletti, F., Fox, P.T., McGuire, P., et al. (2014). The hubs of the human connectome are generally implicated in the anatomy of brain disorders. Brain 137(Pt 8), 2382-2395. View
Lo, C.Y., Su, T.W., Huang, C.C., Hung, C.C., Chen, W.L., Lan, T.H., et al. (2015). Randomization and resilience of brain functional networks as systems-level endophenotypes of schizophrenia. Proc Natl Acad Sci U S A 112(29), 9123-9128. View
Wang, X., Cao, J., and Qin, X. (2016). Study of Robustness in Functionally Identical Coupled Networks against Cascading Failures. PLoS One 11(8), e0160545. View
Li, H., Zhou, H., Yang, Y., Wang, H., and Zhong, N. (2017). More randomized and resilient in the topological properties of functional brain networks in patients with major depressive disorder. J Clin Neurosci. View
Rubinov, M., and Bullmore, E. (2013). Schizophrenia and abnormal brain network hubs. Dialogues Clin Neurosci 15(3), 339-349.View
van den Heuvel, M.P., Sporns, O., Collin, G., Scheewe, T., Mandl, R.C., Cahn, W., et al. (2013). Abnormal rich club organization and functional brain dynamics in schizophrenia. JAMA Psychiatry 70(8), 783-792. View
Collin, G., van den Heuvel, M.P., Abramovic, L., Vreeker, A., de Reus, M.A., van Haren, N.E., et al. (2016). Brain network analysis reveals affected connectome structure in bipolar I disorder. Hum Brain Mapp 37(1), 122-134. doi: 10.1002/ hbm.23017. View
Kay, S.R., Fiszbein, A., and Opler, L.A. (1987). The positive and negative syndrome scale (PANSS) for schizophrenia. Schizophr Bull 13(2), 261-276. View
Tzourio-Mazoyer, N., Landeau, B., Papathanassiou, D., Crivello, F., Etard, O., Delcroix, N., et al. (2002). Automated anatomical labeling of activations in SPM using a macroscopic anatomical parcellation of the MNI MRI single-subject brain. Neuroimage 15(1), 273-289. View
Fisher, R.A. (1915). Frequency distribution of the values of the correlation coefficient in samples of an indefinitely large population. Biometrika 10(4), 507-521. View
van Wijk, B.C., Stam, C.J., and Daffertshofer, A. (2010). Comparing brain networks of different size and connectivity density using graph theory. PLoS One 5(10), e13701. View
Fornito, A., Zalesky, A., and Bullmore, E. (2016). Fundamentals of Brain Netowork Anlaysis. USA: Academic Press. View
Bullmore, E., and Sporns, O. (2009). Complex brain networks: graph theoretical analysis of structural and functional systems. Nat Rev Neurosci 10(3), 186-198. doi: 10.1038/nrn2575. View
Kiviniemi, V., Starck, T., Remes, J., Long, X., Nikkinen, J., Haapea, M., et al. (2009). Functional segmentation of the brain cortex using high model order group PICA. Hum Brain Mapp 30(12), 3865-3886. View
Abou-Elseoud, A., Starck, T., Remes, J., Nikkinen, J., Tervonen, O., and Kiviniemi, V. (2010). The effect of model order selection in group PICA. Hum Brain Mapp 31(8), 1207-1216. View
Schultz, A.P., Chhatwal, J.P., Huijbers, W., Hedden, T., van Dijk, K.R., McLaren, D.G., et al. (2014). Template based rotation: a method for functional connectivity analysis with a priori templates. Neuroimage 102 Pt 2, 620-636. View
Cordes, D., Haughton, V.M., Arfanakis, K., Carew, J.D., Turski, P.A., Moritz, C.H., et al. (2001). Frequencies contributing to functional connectivity in the cerebral cortex in "resting-state" data. AJNR Am J Neuroradiol 22(7), 1326-1333. View
Allen, E.A., Erhardt, E.B., Damaraju, E., Gruner, W., Segall, J.M., Silva, R.F., et al. (2011). A baseline for the multivariate comparison of resting-state networks. Front Syst Neurosci 5, 2. View
Damoiseaux, J.S., Rombouts, S.A., Barkhof, F., Scheltens, P., Stam, C.J., Smith, S.M., et al. (2006). Consistent resting-state networks across healthy subjects. Proc Natl Acad Sci U S A 103(37), 13848-13853. View
Rashid, B., Damaraju, E., Pearlson, G.D., and Calhoun, V.D. (2014). Dynamic connectivity states estimated from resting fMRI Identify differences among Schizophrenia, bipolar disorder, and healthy control subjects. Front Hum Neurosci 8, 897. View
Rudorf, S., Baumgartner, T., Markett, S., Schmelz, K., Wiest, R., Fischbacher, U., et al. (2018). Intrinsic connectivity networks underlying individual differences in control-averse behavior. Hum Brain Mapp 39(12), 4857-4869. View
Alpaydin, E. (2014). Introduction to Machine Learning. Cambridge, Massachusetts: The MIT Press. View
Cortes, C., and Vapnick, V. (1995). Support-vector networks. Machine Learning 20(3), 273-297. View
Cover, T.M., and Hart, P.E. (1967). Nearest neighbor pattern classification. IEEE Transactions on Information Theory 13, 21-27. View
Kantardzic, M. (2011). Data Mining: Concepts, Models, Methods, and Algorithms. Piscataway, NJ: IEEE press. View
Peng, H., Long, F., and Ding, C. (2005). Feature selection based on mutual information: criteria of max-dependency, max-relevance, and min-redundancy. IEEE Trans Pattern Anal Mach Intell 27(8), 1226-1238. View
Genovese, C.R., Lazar, N.A., and Nichols, T. (2002). Thresholding of statistical maps in functional neuroimaging using the false discovery rate. Neuroimage 15(4), 870-878. View
Curtin, F., and Schulz, P. (1998). Multiple correlations and Bonferroni's correction. Biol Psychiatry 44(8), 775-777. View
Skatun, K.C., Kaufmann, T., Tonnesen, S., Biele, G., Melle, I., Agartz, I., et al. (2016). Global brain connectivity alterations in patients with schizophrenia and bipolar spectrum disorders. J Psychiatry Neurosci 41(5), 331-341. View
Suo, X., Lei, D., Li, L., Li, W., Dai, J., Wang, S., et al. (2018). Psychoradiological patterns of small-world properties and a systematic review of connectome studies of patients with 6 major psychiatric disorders. J Psychiatry Neurosci 43(5), 170214.View
Xia, M., Womer, F.Y., Chang, M., Zhu, Y., Zhou, Q., Edmiston, E.K., et al. (2018). Shared and Distinct Functional Architectures of Brain Networks Across Psychiatric Disorders. Schizophr Bull.View
Maliia, M.D., Donos, C., Barborica, A., Popa, I., Ciurea, J., Cinatti, S., et al. (2018). Functional mapping and effective connectivity of the human operculum. Cortex 109, 303-321. View
Sommer, I.E., Clos, M., Meijering, A.L., Diederen, K.M., and Eickhoff, S.B. (2012). Resting state functional connectivity in patients with chronic hallucinations. PLoS One 7(9), e43516. View
Mesmoudi, S., Perlbarg, V., Rudrauf, D., Messe, A., Pinsard, B., Hasboun, D., et al. (2013). Resting state networks' corticotopy: the dual intertwined rings architecture. PLoS One 8(7), e67444. View
Fornito, A., Zalesky, A., and Breakspear, M. (2015). The connectomics of brain disorders. Nat Rev Neurosci 16(3), 159- 172. View
Schnack, H.G., Nieuwenhuis, M., van Haren, N.E., Abramovic, L., Scheewe, T.W., Brouwer, R.M., et al. (2014). Can structural MRI aid in clinical classification? A machine learning study in two independent samples of patients with schizophrenia, bipolar disorder and healthy subjects. Neuroimage 84, 299-306. View
Ellison-Wright, I., and Bullmore, E. (2010). Anatomy of bipolar disorder and schizophrenia: a meta-analysis. Schizophr Res 117(1), 1-12. doi: 10.1016/j.schres.2009.12.022. View
Vargas, C., Lopez-Jaramillo, C., and Vieta, E. (2013). A systematic literature review of resting state network--functional MRI in bipolar disorder. J Affect Disord 150(3), 727-735. View
Liu, Y., Liang, M., Zhou, Y., He, Y., Hao, Y., Song, M., et al. (2008). Disrupted small-world networks in schizophrenia. Brain 131(Pt 4), 945-961. View
Ellison-Wright, I., and Bullmore, E. (2009). Meta-analysis of diffusion tensor imaging studies in schizophrenia. Schizophr Res 108(1-3), 3-10. View
Lynall, M.E., Bassett, D.S., Kerwin, R., McKenna, P.J., Kitzbichler, M., Muller, U., et al. (2010). Functional connectivity and brain networks in schizophrenia. J Neurosci 30(28), 9477- 9487. View
Fornito, A., Zalesky, A., Pantelis, C., and Bullmore, E.T. (2012). Schizophrenia, neuroimaging and connectomics. Neuroimage 62(4), 2296-2314. View
Cheng, W., Palaniyappan, L., Li, M., Kendrick, K.M., Zhang, J., Luo, Q., et al. (2015). Voxel-based, brain-wide association study of aberrant functional connectivity in schizophrenia implicates thalamocortical circuitry. NPJ Schizophr 1, 15016. View
Griffa, A., Baumann, P.S., Ferrari, C., Do, K.Q., Conus, P., Thiran, J.P., et al. (2015). Characterizing the connectome in schizophrenia with diffusion spectrum imaging. Hum Brain Mapp 36(1), 354-366. View
Yang, G.J., Murray, J.D., Wang, X.J., Glahn, D.C., Pearlson, G.D., Repovs, G., et al. (2016). Functional hierarchy underlies preferential connectivity disturbances in schizophrenia. Proc Natl Acad Sci U S A 113(2), E219-228. View
O'Donoghue, S., Holleran, L., Cannon, D.M., and McDonald, C. (2017). Anatomical dysconnectivity in bipolar disorder compared with schizophrenia: A selective review of structural network analyses using diffusion MRI. J Affect Disord 209, 217-228. View
Brandt, C.L., Eichele, T., Melle, I., Sundet, K., Server, A., Agartz, I., et al. (2014). Working memory networks and activation patterns in schizophrenia and bipolar disorder: comparison with healthy controls. Br J Psychiatry 204, 290-298. doi: 10.1192/ bjp.bp.113.129254. View
Fornito, A., Harrison, B.J., Goodby, E., Dean, A., Ooi, C., Nathan, P.J., et al. (2013). Functional dysconnectivity of corticostriatal circuitry as a risk phenotype for psychosis. JAMA Psychiatry 70(11), 1143-1151. doi: 10.1001/jamapsychiatry.2013.1976. View
Anticevic, A., Cole, M.W., Repovs, G., Murray, J.D., Brumbaugh, M.S., Winkler, A.M., et al. (2014). Characterizing thalamo-cortical disturbances in schizophrenia and bipolar illness. Cereb Cortex 24(12), 3116-3130. doi: 10.1093/cercor/ bht165. View
Baker, J.T., Holmes, A.J., Masters, G.A., Yeo, B.T., Krienen, F., Buckner, R.L., et al. (2014). Disruption of cortical association networks in schizophrenia and psychotic bipolar disorder. JAMA Psychiatry 71(2), 109-118. View
Wolfers, T., Doan, N.T., Kaufmann, T., Alnaes, D., Moberget, T., Agartz, I., et al. (2018). Mapping the Heterogeneous Phenotype of Schizophrenia and Bipolar Disorder Using Normative Models. JAMA Psychiatry 75(11), 1146-1155. View
Arieli, A., Sterkin, A., Grinvald, A., and Aertsen, A. (1996). Dynamics of ongoing activity: explanation of the large variability in evoked cortical responses. Science 273(5283), 1868-1871. View
Onton, J., and Makeig, S. (2006). Information-based modeling of event-related brain dynamics. Prog Brain Res 159, 99-120. View