
- About the Journal
- Editorial Board
- Review Process
- Author Guidelines
- Article Processing Charges
- Special Issues
- Current Issue
- Past Issue
 Current Research in Materials Chemistry
Current Research in Materials Chemistry Volume 3 (2021), Article ID: CRMC-110
https://doi.org/10.33790/crmc1100110Research Article
Effect of Fabrication Conditions on the Performance of Porous Polyviny- lidene Fluoride (PVDF) Piezoelectric Sensors under Compression
Jared A. Tucker 1, Matthew J. Danley 2, Jack T. Kloster 3, Ping Zhao 3, & Victor K. Lai 1
1Department of Chemical Engineering,University of Minnesota Duluth 238 Engineering Building ,1303 Ordean Court, Duluth, MN 55812,United States.
2Department of Chemistry and Biochemistry,University of Minnesota Duluth 14 126 HCAMS, 1038 University Drive,Duluth, MN 55812, United States.
3Department of Mechanical and Industrial Engineering,University of Minnesota – Duluth,Voss Kovach Hall 105,1305 Ordean Court Duluth, MN 55812, United States.
Corresponding Author Details: Victor K. Lai, Assistant Professor in Chemical Engineering, University of Minnesota Duluth 238 Engineering Building ,1303 Ordean Court, Duluth, MN 55812,United States. E-mail: laix0066@d.umn.edu
Received date: 25th May, 2021
Accepted date: 01st July, 2021
Published date: 07th July, 2021
Citation: Tucker, J.A., Danley, M.J., Kloster, J.T., Zhao, P., & Lai, V.K. (2021). Effect of Fabrication Conditions on the Performance of Porous Polyvinylidene Fluoride (PVDF) Piezoelectric Sensors under Compression.
Copyright:©2021, This is an open-access article distributed under the terms of the Creative Commons Attribution License 4.0, which permits unrestricted use, distribution, and reproduction in any medium, provided the original author and source are credited.Creative Commons Attribution License, which permits unrestricted use, distribution, and reproduction in any medium, provided the original author and source are credited
Abstract
Polyvinylidene Fluoride (PVDF) is a piezoelectric polymer that has many different applications and uses. Two measurable characteristics of PVDF films are the conformation of the polymer chain and the piezoelectric output. There has been little investigation on how different abrication factors can influence both characteristics. The goal of this study is to determine how different factors can have an effect on the chain conformation and the piezoelectric output of porous PVDF films. To fabricate the PVDF films, PVDF powder was dissolved in 2-butanone and 40 wt% of Zinc Oxide (ZnO) nanoparticles were added to the solution. Once the film was dried, the ZnO nanoparticles were dissolved using 10M hydrochloric acid to leave a mesoporous PVDF film. The fabrication factors studied were (1) the total sample weight of PVDF and ZnO, (2) the amount of 2-butanone solvent, and (3) the % solvent removed in the oven before air-drying. To determine the effect of the fabrication factors, the films were characterized mechanically via an instantaneous compressive load using a tensile tester and measuring the peak voltage generated, and structurally using Fourier Transform Infrared Spectroscopy (FTIR) to estimate the fraction of electroactive chain conformation. It was determined that the total amount of PVDF had a significant effect on the piezoelectric voltage output from the compression tests, while the amount of solvent affected the relative amounts of the different crystalline phases. Interestingly, normalizing the voltage output per PVDF mass shows diminishing returns in voltage generated with increasing amount of PVDF. Unexpectedly, no direct correlation between amount of electroactive chain conformation and the piezoelectric output was observed, which suggests other confounding factors (e.g., pore size distribution, PVDF network architecture) that may influence the piezoelectric voltage output.
Keywords: Piezoelectric polymer, Porosity, Crystalline phases, Voltage output, Microstructures, FTIR spectra
Introduction
Polyvinylidene fluoride (PVDF) is a well-known polyamide polymer that has applications in a variety of industries such as construction, biomedical, and defense [1-4]. PVDF also exhibits piezoelectric behavior, in which forces upon the polymer, such as tension, compression, or shear stress result in a net electrical potential difference within the material. This voltage can be measured and observed to determine the characteristics of the force. Previous researchers have used PVDF sensors to measure the arterial pulse wave velocity for biomedical applications by measuring the pressure propagation through the patient’s arm [5]. It has also been shown that PVDF can also serve as a means to measure flow velocity [6]. This concept of piezoelectricity also makes PVDF a great candidate for applications such as energy harvesting in many different applications. Since PVDF is also highly biocompatible, recent investigations have focused on the potential of wearable PVDF textiles that convert vibrations from the user to usable electrical energy [7-10]. This high biocompatibility paired with the high flexibility of the polymer in comparison to other piezo ceramics also offers great potential for biomedical applications of PVDF sensors for measurements, instrumentations, or therapeutics [11].
The piezoelectricity in PVDF, as with many other piezoelectric polymers, is dependent on the crystallinity structure of the sample. Within PVDF, there are three major phases in which the polymer crystallinity can form: α, β, and γ. Due to the stereochemistry of the packing, only β and γ phases exhibit piezoelectric characteristics [12]. For the β -phase packing, the conformation of the molecule is trans-trans, which allows for a separation of charge within the polymer [13]. For γ-phase PVDF, the conformation of the chain makes it net ionic, just as β -phase, but the overall piezoelectricity is weaker due to a gauche bond every fourth repeating unit [14]. For the purposes of piezoelectricity, the goal for use is to maximize the β and γ phases present in the polymer, having β phase as the more desired packing. The increase of β -phase PVDF has been accomplished in several different methods. One technique is to modify the physiochemical structure of the polymer system in order to obtain more β -phase packing in the system, such as adding cellulose to the solution or doping with metallics or reduced graphene oxides [15,16]. Another method for inducing the piezoelectric phase is by poling the PVDF sample under high voltage. This forces the polymer chain into the highest polarized form [17]. There has also been recent investigation into increasing the voltage output of the PVDF sample by introducing porosity into the polymer system [18]. However, there has been little investigation into how the conditions of the fabrication affects the β -phase and voltage output of the polymer. Thus, the goal of this work is to study the effect that the factors in the fabrication process change the output of the mesoporous PVDF sample. To implement this porosity in the polymer, Zinc Oxide (ZnO) nanoparticles are suspended in the polymer solution before drying. Once the polymer is dried, the ZnO can be dissolved out of the system with hydrochloric acid (HCl), which does not react chemically with the stable PVDF. This will leave a product that contains a system of pores that can increase the performance of the material. Ultimately, the goal is to maximize the β -phase within the system, since it has the strongest piezoelectricity. A large factor in the packing phase is the fabrication process for the samples. The method of the fabrication process has a majority of the effect on the packing. For example, many procedures use electrospinning to increase the β -phase in the polymer crystallinity [19]. However, there are other methods, such as the flow casting of a PVDF solution into individual dishes for drying. This gives high control over the dimensions of the sample and the β-phase present based on the work of Wushang et al [20]. It has also been shown by previous studies that annealing temperature has an effect on the final β -phase in the polymer system [21]. In order to explore the effects that the other fabrication conditions have on the final product, a full factorial design of experiments was conducted, focusing on the solvent volume used, the weight of the PVDF powder added, and the percent of solvent that was evaporated in the oven before removing and allowing to air dry. For all of the samples, the ZnO content in the solution was 40% of the total sample weight. Once the samples were fabricated, analysis of the β -phase concentration was conducted through Fourier Transform Infrared Spectroscopy (FTIR) analysis, and the piezoelectric output was measured through compression testing. The results were interpreted within the Minitab program to determine the statistical significance of each factor, the main effects, interactions, and the optimized scheme for the PVDF fabrication.
Materials and Methods
PVDF Fabrication
The PVDF films were fabricated similar to the protocol as detailed in [18]. Briefly, PVDF powder (Alfa Aesar, Ward Hill, MA) with 2-butanone (Alfa Aesar, Ward Hill, MA) as a solvent were used as the base for the polymerization. To introduce porosity into the sample, 35-45 nm ZnO nanoparticles (US Research Nanomaterials, Houston, TX) were combined with the polymer solution. To reach the desired porosity, the ZnO powder and PVDF were always added in a 40:60 weight ratio, depending on the total sample weight desired (see Table 1 below). First, the PVDF powder was dissolved in the desired amount of 2-butanone and allowed to polymerize in the oven at 80°C for 30 minutes, shaking every few minutes to keep the polymer from solidifying on the bottom of the vial. Once the solution was heated, the desired weight of ZnO powder was added to the new polymer solution vials. In order to evenly distribute the ZnO particles among the PVDF polymer, the new vials were inserted into a float and added to an ultrasonic bath for 30 minutes. After sonication, the sample was then poured into a 40mL glass petri dish, covered, and put into the oven at70°C until a certain percent of the solvent had evaporated (see Table 1), followed by air-drying at room temperature with the cover still on. To remove the ZnO within the sample to create the porous structure, the samples were placed in a 10M HCl (Avantor Inc., Allentown, PA) bath overnight with a stir bar to dissolve the ZnO. Once dissolved, the samples were placed in a water bath to remove the HCl and then dried after an hour. Removal of the ZnO nanoparticles creates the porous microstructure within the PVDF network.
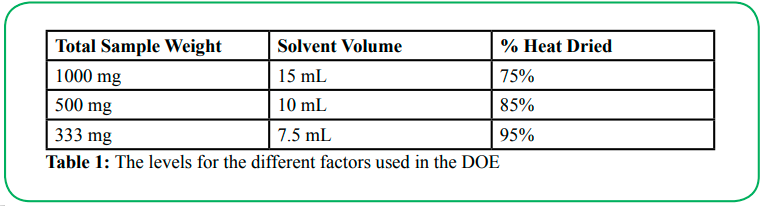
Table 1: The levels for the different factors used in the DOE
Three factors were investigated in the design of experiments (DOE):
1. Total sample weight: Keeping the weight ratio of ZnO to PVDF constant in all cases, here we probe the effect of PVDF film thickness on its piezoelectric voltage output.
2. butanone solvent volume: The amount of solvent used to dissolve the ZnO and PVDF during the fabrication process may affect the resulting microstructure and/or relative amounts of each crystalline phase.
3. % heat dried: Similar to (2), here we investigate the possible effects of altering the drying process on the resulting microstructure and crystalline composition. In order to evaluate the percent of drying of the sample within the oven, the solvent was weighed to determine the overall mass. Before the PVDF/ZnO solution was put in the oven, the dish that contained the sample, Wtotal, was weighed. The final weight, Wfinal, for the desired % drying was determined by the following equation:
Wfinal = Wtotal − (% drying) × Wsolvent
where Wsolvent is the weight of the initial amount of solvent added. Wfinal was determined by weighing the sample every 15 minutes, and the sample is removed from the oven to air-dry once the desired solvent amount has been evaporated. The three levels that were used for each factor are shown in Table 1, giving a total of 27 different samples.
In total, three circular PVDF films were fabricated for each set of conditions (81 films total). A square of approximately 1.5” was cut out from each circular film, and five replicates of the compression test were done for each sample square (15 replicates total for each set of conditions). Subsequently, FTIR spectra was obtained at four different locations of each sample square (12 replicates total for each set of conditions). Figure 1 shows (A) an actual sample of a fabricated PVDF film, (B) a square sample cut out for testing, and (C) a schematic showing the replicates obtained for each of the factor combinations.
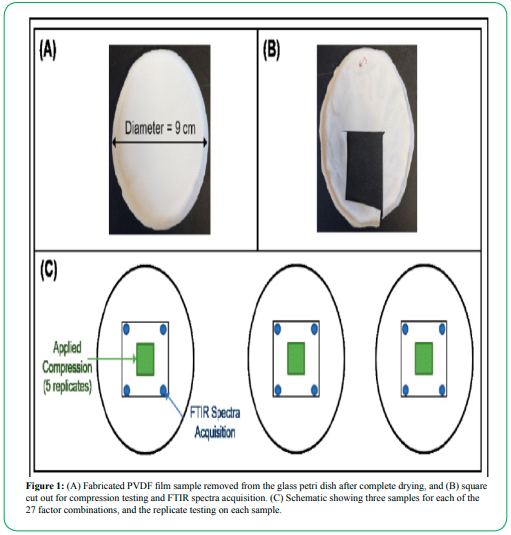
Figure 1: (A) Fabricated PVDF film sample removed from the glass petri dish after complete drying, and (B) square cut out for compression testing and FTIR spectra acquisition. (C) Schematic showing three samples for each of the 27 factor combinations, and the replicate testing on each sample.
Compression Testing
Samples were prepared for compression testing by applying 1” x 1” copper tape electrodes on opposite faces of the film. The area of the sample covered with the copper tape was then cut out and ½” width copper tape leads were attached to both electrode faces. The copper tape electrodes were pressed onto the films with the flat edge, so as to minimize the amount of air trapped between the electrodes and the films.
Compression testing was done with a Test Resources Newton 100 series Tensile Tester with a 1000 lbf actuator (Test Resources Inc, Shakopee, MN). Data was collected with National Instruments data acquisition hardware (NI cDAQ-9174 chassis, NI 9215 input module) with LabView software. Tests were run for 10 seconds each at a sampling rate of 1000 Hz. Four variables were recorded during testing: three independent variables (time, position of the tester grips, and load applied by the tester), and one dependent variable (electric potential difference between the opposite faces of the film).
The apparatus used for compression testing is shown in Figure 2. During testing, PVDF samples were placed flat on a support block held between the lower grips of the uniaxial tester. In the upper grips, a plastic compression part was held that would be lowered onto the PVDF sample below, compressing the center of the sample over a ½” x ½” area. Each compression test consisted of two main steps. The first step applied a compressive preload of 8.90 N (2 lbf), with the tester grips descending at a rate of 1 mm/sec. Once the preload was applied, the grips dwelled for 3 seconds before beginning the second test step. This second step applied the actual compressive load to generate a voltage output, by applying a 0.4 mm displacement of the upper grip at a rate of 100 mm/min. These displacements were relative to the preloading position to ensure that approximately the same load was achieved with each run.
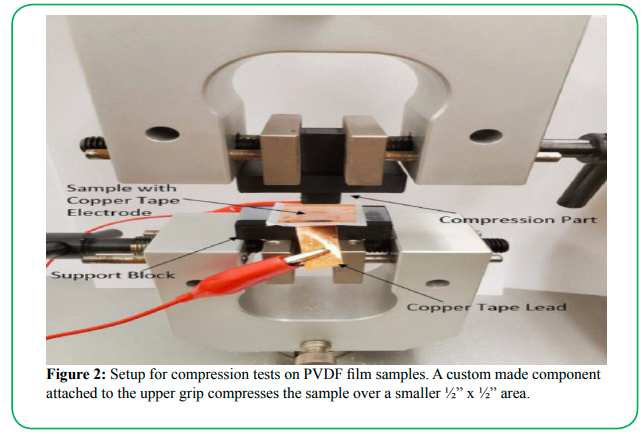
Figure 2: Setup for compression tests on PVDF film samples. A custom made component attached to the upper grip compresses the sample over a smaller ½” x ½” area.
Microstructural Characterization
The relative amounts of each crystalline phase was estimated using FTIR using a Nicolet iS50 FT-IR (Thermo Scientific, Waltham, MA). Ominic software was used to control the instrument, collecting 64 scans for each spectrum at a resolution of 4cm-1. Four replicates were collected on each sample, one at each corner of the square film next to the copper tape electrode.
The analysis of each spectrum to obtain the fraction of each
crystalline phase is detailed in [22]. Briefly, the fraction of
electroactive conformations β and γ,F
where I840 is the absorbance from the spectra at 840cm-1, I763 is the absorbance from the spectra at 763cm-1, K840 is the absorption coefficient at 840cm-1 which is 77,000 cm2*mol-1 and K763, the absorption coefficients at 763cm-1 which is 61,000cm2*mol-1. Subsequently, equations 3 and 4 are used to separate the amount of β and γ phases respectively: 𝐹(𝛽) = 𝐹𝐸𝐴 ∗ (𝛥𝐻𝛽/𝛥𝐻𝛽+ 𝛥𝐻 ) ∗ 100% ---(3), 𝐹(𝛾) = 𝐹𝐸𝐴 * 𝛥𝐻𝛾/(𝛥𝐻 + 𝛥𝐻 ) ∗ 100% ---(4)
where ΔHβ is the difference in absorbance values between the nearest peak at 1275cm-1 and the nearest valley at 1260cm-1, and ΔHγ is the difference in absorbance values at the nearest peak at 1234cm-1 and the nearest valley near 1225cm-1.
Data Analysis
To analyze the compression data, the voltage generated from the sample was filtered using a 5-point Savitzky-Golay fit to increase the signal to noise ratio [23]. The voltage peak generated from the compression was found by finding the maximum voltage change from the baseline voltage when the load from the tensile tester was applied, and this voltage value normalized by the load applied. An example spectrum is shown in Figure 3.
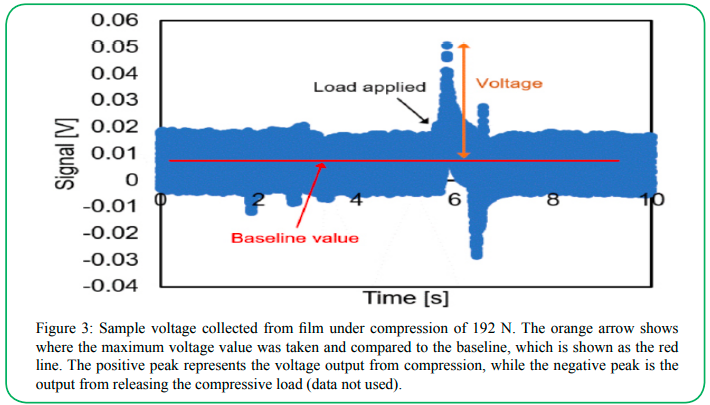
Figure 3: Sample voltage collected from film under compression of 192 N. The orange arrow shows where the maximum voltage value was taken and compared to the baseline, which is shown as the red line. The positive peak represents the voltage output from compression, while the negative peak is the output from releasing the compressive load (data not used).
To analyze the effects of each variable, as well as any interaction effects between the variables a full factorial DOE was created in Minitab® (v19.2020.1, Minitab, Inc., State College, PA). A general linear ANOVA test was conducted in Minitab® for both the compression results and the FTIR spectra results with respect to the 3 factor levels.
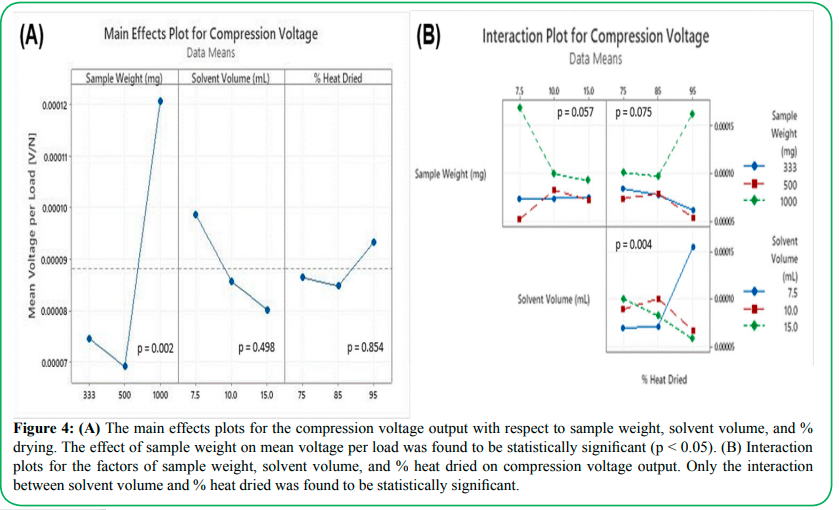
Figure 4: (A) The main effects plots for the compression voltage output with respect to sample weight, solvent volume, and % drying. The effect of sample weight on mean voltage per load was found to be statistically significant (p < 0.05). (B) Interaction plots for the factors of sample weight, solvent volume, and % heat dried on compression voltage output. Only the interaction between solvent volume and % heat dried was found to be statistically significant.
Results and Discussion
Figure 4 shows the main effects as well as interaction effects of the three variables on the compression voltage output. Only the sample weight was found to have a statistically significant effect on the voltage per load output of the sample (p = 0.002), with the 1000 mg PVDF sample exhibiting higher average volts per load compared to the 333 mg and 500 mg samples (Figure 4A). The volume of solvent used in fabrication was found to have no significant effect on the voltage per load output (p = 0.498), and the fraction of drying time spent in the oven showed a similarly insignificant effect (p = 0.854). Interaction effects between the three variables (Figure 4B) are stronger compared to main effects alone, with all p-values less than 0.1; however, only the interaction between solvent volume and % heat dried is statistically significant at the 0.05 level. The highest voltage output per load was obtained with the lowest solvent volume of 7.5 mL coupled with the highest % heat dried at 95%, which suggests that minimizing the amount of solvent needed while maximizing the rate of solvent evaporation under high heat produces films with the better piezoelectric output. While there is little previous research into how the rate of drying effects the overall piezoelectricity, there has been evidence that points to the effect that drying method has on the overall structure of the PVDF as well as piezoelectric performance. A study conducted into supercritical drying of PVDF-HFP copolymer solution shows that the mesoporous structure of the gel maintains a high regularity compared to air-dried samples [24]. This consistency within the structure and the porosity of the polymer system allows for great interactions between the force, whether compression, tensile, or shear, and the surface area of the PVDF interface. This supercritical drying investigation also yielded evidence that the rate of the solvent removal has a strong effect on the final structure of the system. By removing the solvent at a high rate from the polymer system, it has less effect on the porosity and crystalline structure of the PVDF. This aligns with the evidence found here that the more the sample was dried under elevated temperature, the greater the piezoelectric output. Drying more under higher temperature will increase the rate of solvent removal from the sample. While the ZnO is still present in the sample while drying, there is likely still some micropores present within the system for the evaporating solvent to affect the structure. Thus, the results found in this study compares well to the finding of the effects of heat drying and sample output.
In both the main effects and interaction effects plots, the highest sample weight of 1000 mg gave significantly higher voltage outputs compared to sample weights of 500 mg and 333 mg. This result is expected, since the films of higher sample weights are thicker and intrinsically contain more PVDF material within the sample. Within energy harvesting research, a similar trend was noticed within piezoceramic performance. Within piezoelectric transducers, it was found that the relationship between layer thickness of the piezoelectric material and the voltage output was directly proportional [25]. While it was also found that there is a critical thickness in which piezoelectric output begins to decline due to rigidity of the sample layers, for the purposes of this study, a single layer PVDF sample should match the trend of increased performance with increasing thickness. By maximizing the amount of material present to create a voltage, the greater response there will be to the introduced force. Closer inspection of this gain by normalizing the voltage output by the amount of PVDF material, however, exhibits an interesting trend (Figure 5). The normalized voltage per mass of PVDF decreases with increasing amount of PVDF in the film, which suggests diminishing returns on voltage gain. As changing the total weight also alters the thickness of the film which would influence heat transfer and drying characteristics, it is unclear the specific cause(s) for this diminishing voltage gain due to these confounding factors which requires further investigation.

Figure 5: Voltage output per load normalized by mass of PVDF shows a decreasing trend with increasing sample weight, which suggests diminishing returns despite having more piezoelectric PVDF material in the sample. Error bars represent the standard error from all replicates for each sample weight.
Figure 6 shows the main effects plots and interaction effects of the three fabrication variables on the combined concentrations of β and γ microstructural phases within the PVDF films. The only factor that was found to have a significant effect on the mean β/γ concentration was the amount of solvent used during fabrication (p = 0.003). The smallest volume of solvent, 7.5 mL, resulted in samples that averaged nearly 8% less in combined β and γ phases when compared with samples prepared with 10 mL and 15 mL of solvent (Figure 6A). The mechanisms behind why the solvent volume affects the phase concentration of the PVDF are not fully understood. However, this observation supports the hypothesis that certain variables within the fabrication process can play a significant role in determining the characteristics of the material. In a 2015 study that considered the effects of fabrication techniques on the crystalline phases of PVDF, it was found that the weight-volume ratio of PVDF to dimethyl formamide solvent had no effect on the amount of beta phase that formed in the PVDF films [26]. This finding is contrary to the effects of solvent volume found in this study, which could potentially be due to other confounding factors that were not accounted for in this study. Mahato et al. determined that thermal energy was a significant factor in the amount of beta phase formed during synthesis [26]. This study did not consider variable drying temperatures as a factor. However, the % heat drying factor did account for differences in the amount of thermal energy the samples were exposed to during synthesis. The % heat drying, however, showed no significant effect on the concentrations of beta and gamma phases in this study (p=0.555), which could potentially be due to only small overall differences in the amount of thermal energy between the 75%, 85%, and 95% groups. The mass of PVDF also proved to have an insignificant effect on the phase concentrations (p=0.105).
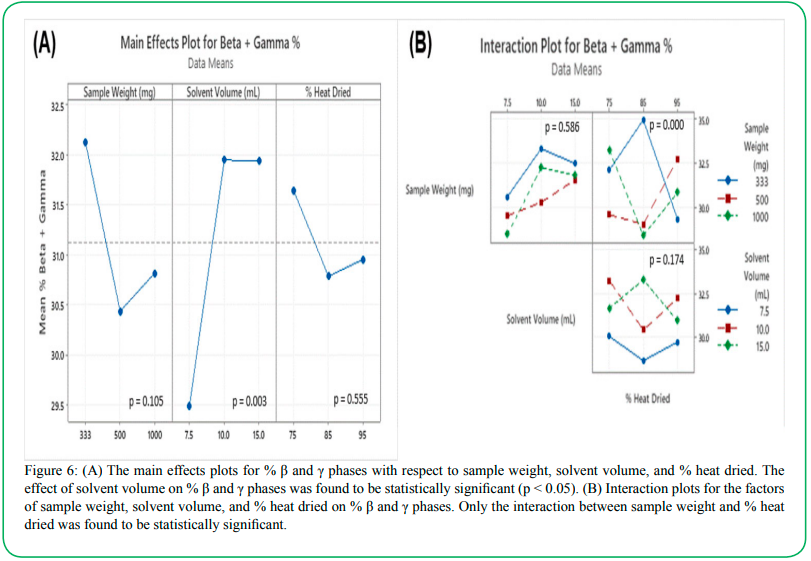
Figure 6: (A) The main effects plots for % β and γ phases with respect to sample weight, solvent volume, and % heat dried. The effect of solvent volume on % β and γ phases was found to be statistically significant (p < 0.05). (B) Interaction plots for the factors of sample weight, solvent volume, and % heat dried on % β and γ phases. Only the interaction between sample weight and % heat dried was found to be statistically significant.
The interaction plots in Figure 6B represent how each of the three independent variables interact with one another, regarding their effects on the phase concentration. The solvent volume and mass of PVDF showed no significant interaction with one another (p = 0.586), and the interaction between the solvent volume and fraction of drying time in the oven was also determined to be statistically insignificant at the 0.05 level (p = 0.174). The amount of PVDF and the oven time fraction were found to interact significantly (p < 0.001). In this plot, it can be seen that both the 500 mg and 1000 mg sets exhibited the lowest concentrations of β and γ phases when the oven-dried fraction was 85%. However, for the 333 mg set, this observation is opposite, as the 85% oven-dried samples exhibited the highest β/γ concentrations. This inconsistency is evidence that at low masses of PVDF, there is interaction occurring between the PVDF mass and the fraction of time spent drying in the oven. Since these two variables are shown to interact with one another, it would be useful in future studies to isolate these variables shown to interact with one another, it would be useful in future studies to isolate these variables from each other in order to study their individual effects on the phase concentrations of PVDF.
Taken together, the best combination of factors investigated that gave the highest piezoelectric voltage output is a 1000 mg total sample weight, using 7.5 mL of 2-butanone solvent, with heat drying up to 95% before removal from the oven. This factor combination, however, does not contain the highest proportion of β/γ phases within the sample, which was observed at 333 mg total sample weight, using 15 mL of solvent, and heat drying up to 85% (see Supplemental Data for the full set of voltage output and % β/γ phase results). While it is known that only β and γ phases of PVDF exhibit piezoelectric properties, our data does not show a distinct trend of increasing voltage output with % β/γ phases within the sample (Figure 7). This unexpected result suggests that the amount of β and γ chain confirmation present is not the sole variable in causing a piezoelectric output. Other variables on a microstructural level such as porosity or PVDF network architecture could affect the piezoelectric voltage output as these pores allow the films to collapse further upon compression.
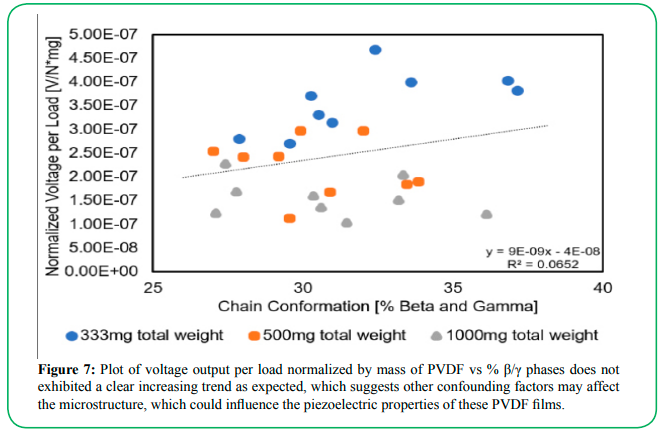
Figure 7: Plot of voltage output per load normalized by mass of PVDF vs % β/γ phases does not exhibited a clear increasing trend as expected, which suggests other confounding factors may affect the microstructure, which could influence the piezoelectric properties of these PVDF films.
Acknowledgements
This work is funded by the University of Minnesota’s Grant-in-Aid of Research, Artistry, and Scholarship program.
Competing Interests
The authors declare that they have no competing interests.
References
B. Sun., et al., (2019). “Electrospun poly(vinylidene fluoride)- zinc oxide hierarchical composite fiber membrane as piezoelectric acoustoelectric nanogenerator,” J. Mater. Sci., vol. 54, no. 3, pp. 352 2754–2762, doi: 10.1007/s10853-018-2985-x. View
C. Sun, J. Shi, and X. Wang., (2010). “Fundamental study of mechanical energy harvesting using piezoelectric nanostructures,” J. Appl. Phys., vol. 108, no. 3, p. 034309, doi: 10.1063/1.3462468.View
J. Yan et al., (2019). “Performance enhancements in poly(vinylidene fluoride)-based piezoelectric nanogenerators for efficient energy harvesting,” Nano Energy, vol. 56, pp. 662– 692, doi: 10.1016/j.nanoen.2018.12.010.View
U. Yaqoob, A. S. M. I. Uddin, and G.-S. Chung, (2017). “A novel tri-layer flexible piezoelectric nanogenerator based on surface-modified graphene and PVDF-BaTiO3 nanocomposites,” Appl. Surf. Sci., vol. 405, pp. 420–426, doi: 10.1016/j. apsusc.2017.01.314.View
J. McLaughlin, M. McNeill, B. Braun, and P. D. McCormack., (2003). “Piezoelectric sensor determination of arterial pulse wave velocity,” Physiol. Meas., vol. 24, no. 3, pp. 693–702, doi: 10.1088/0967-3334/24/3/306.View
Q. Li, J. Xing, D. Shang, and Y. Wang., (2019). “A Flow Velocity Measurement Method Based on a PVDF Piezoelectric Sensor,” Sensors, vol. 19, no. 7, p. 1657, doi: 10.3390/s19071657.View
A. Gheibi, M. Latifi, A. A. Merati, and R. Bagherzadeh., (2014). “Piezoelectric electrospun nanofibrous materials for self-powering wearable electronic textiles applications,” J. Polym. Res., vol. 21, no. 7, p. 469, doi: 10.1007/s10965-014-0469-5.View
X. Liu, J. Ma, X. Wu, L. Lin, and X. Wang., (2017). “Polymeric Nanofibers with Ultrahigh Piezoelectricity via Self-Orientation of Nanocrystals,” ACS Nano, vol. 11, no. 2, pp. 1901–1910, doi: 10.1021/acsnano.6b07961.View
L. Persano et al., (2013). “High performance piezoelectric devices based on aligned arrays of nanofibers of poly(vinylidenefluoride-co-trifluoroethylene),” Nat. Commun., vol. 4, no. 1, Art. no. 1, doi: 10.1038/ncomms2639.View
Y. Zhang et al., (2014). “PVDF–PZT nanocomposite film based self-charging power cell,” Nanotechnology, vol. 25, no. 10, p. 105401, doi: 10.1088/0957-4484/25/10/105401.View
P. Martins, A.C. Lopes, and S. Lanceros-Mendez., (2014). “Electroactive phases of poly(vinylidene fluoride): Determination, processing and applications,” Prog. Polym. Sci., vol. 39, no. 4, pp. 683–706, doi: 10.1016/j. progpolymsci.2013.07.006.View
N. Murayama, K. Nakamura, H. Obara, and M. Segawa., (1976). “The strong piezoelectricity in polyvinylidene fluroide (PVDF),” Ultrasonics, vol. 14, no. 1, pp. 15–24, doi: 10.1016/0041-624X(76)90067-6.View
M. El Achaby, F. Z. Arrakhiz, S. Vaudreuil, E. M. Essassi, and A. Qaiss., (2012). “Piezoelectric β-polymorph formation and properties enhancement in graphene oxide – PVDF nanocomposite films,” Appl. Surf. Sci., vol. 258, no. 19, pp. 7668–7677, doi: 10.1016/j.apsusc.2012.04.118.View
L. Ruan, X. Yao, Y. Chang, L. Zhou, G. Qin, and X. Zhang., (2018). “Properties and Applications of the β Phase Poly(vinylidene fluoride),” Polymers, vol. 10, no. 3, p. 228, Feb. doi:10.3390/polym10030228.View
P. S. M. Rajesh, S. Bodkhe, S. Kamle, and V. Verma., (2014). “Enhancing beta-phase in PVDF through physicochemical modification of cellulose,” Electron. Mater. Lett., vol. 10, no. 1, pp. 315–319, doi: 10.1007/s13391-013-3083-5.View
Md. Ataur Rahman and G.-S. Chung., (2013). “Synthesis of PVDF-graphene nanocomposites and their properties,” J. Alloys Compd., vol. 581, pp. 724–730, doi:10.1016/j. jallcom.2013.07.118.View
B. Bera and M. D. Sarkar., (2017). “Piezoelectricity in PVDF and PVDF Based Piezoelectric Nanogenerator: A Concept,” IOSR J. Appl. Phys., vol. 09, no. 03, pp. 95–99, doi:10.9790/4861- 0903019599.View
Y. Mao, P. Zhao, G. McConohy, H. Yang, Y. Tong, and X. Wang., (2014). “Sponge-Like Piezoelectric Polymer Films for Scalable and Integratable Nanogenerators and Self-Powered Electronic Systems,” Adv. Energy Mater., vol. 4, no. 7, p. 1301624, doi:10.1002/aenm.201301624.View
S. M. Damaraju, S. Wu, M. Jaffe, and T. L. Arinzeh., (2013). “Structural changes in PVDF fibers due to electrospinning and its effect on biological function,” Biomed. Mater., vol. 8, no. 4, p.045007, doi: 10.1088/1748-6041/8/4/045007.View
“Preparation method of PVDF (polyvinylidene fluoride) (2015). film and PVDF film,” CN104877151A .View
M. Satthiyaraju and T. Ramesh., (2019). “Effect of annealing treatment on PVDF nanofibers for mechanical energy harvesting applications,” Mater. Res. Express, vol. 6, no. 10, p. 105366, doi: 10.1088/2053-1591/ab4037.View
X. Cai, T. Lei, D. Sun, and L. Lin., (2017). “A critical analysis of the α, β and γ phases in poly(vinylidene fluoride) using FTIR,” RSC Adv., vol. 7, no. 25, pp. 15382–15389, doi: 10.1039/ C7RA01267E.View
Abraham. Savitzky and M. J. E. Golay., (1964). “Smoothing and Differentiation of Data by Simplified Least Squares Procedures.,” Anal. Chem., vol. 36, no. 8, pp. 1627–1639, doi: 10.1021/ac60214a047.View
S. Cardea, A. Gugliuzza, M. Sessa, M. C. Aceto, E. Drioli, and E. Reverchon., (2009). “Supercritical Gel Drying: A Powerful Tool for Tailoring Symmetric Porous PVDF−HFP Membranes,” ACS Appl. Mater. Interfaces, vol. 1, no. 1, pp. 171–180, doi: 10.1021/am800101a.View
C. Covaci and A. Gontean., (2020). “Piezoelectric Energy Harvesting Solutions: A Review,” Sensors, vol. 20, no. 12, Art. no. 12, doi: 10.3390/s20123512.View
P. K. Mahato, A. Seal, S. Garain, and S. Sen., (2015). “Effect of fabrication technique on the crystalline phase and electrical properties of PVDF films,” Mater. Sci.-Pol., vol. 33, no. 1, Art. no. 1.View