
- About the Journal
- Editorial Board
- Review Process
- Author Guidelines
- Article Processing Charges
- Special Issues
- Current Issue
- Past Issue
 Current Research in Materials Chemistry
Current Research in Materials Chemistry Volume 3 (2021), Article ID: CRMC-112
https://doi.org/10.33790/crmc1100112Research Article
Type-II Heterojunctions in SnO2-Coated TiO2 Core-Shell Nanoparticles
Riddhiman Medhi1, Nhat Ngo1, Tai-Chou Lee2, and T. Randall Lee1*,
1 Department of Chemistry and the Texas Center for Superconductivity, University of Houston, 4800 Calhoun Road, Houston, Texas 77204- 5003, United States.
2 Department of Chemical and Materials Engineering, National Central University, 300 Jhongda Road, Jhongli City 32001, Taiwan
Corresponding Author Details: Lee, T. R., Ph.D., Cullen Distinguished University Chair & Associate Dean for Research, College of Natural Sciences and Mathematics, University of Houston, TX 77204-5003. United States. E-mail: trlee@uh.edu
Received date: 04th October, 2021
Accepted date: 27th December, 2021
Published date: 29th December, 2021
Citation: Medhi, R., Ngo, N., Lee, T.C., Lee,T. R. (2021). Type-II Heterojunctions in SnO2 -Coated TiO2 Core-Shell Nanoparticles. Cur Res Mater Chem 3(1): 112.
Copyright: ©2021, This is an open-access article distributed under the terms of the Creative Commons Attribution License 4.0, which permits unrestricted use, distribution, and reproduction in any medium, provided the original author and source are credited.Creative Commons Attribution License, which permits unrestricted use, distribution, and reproduction in any medium, provided the original author and source are credited
Abstract
Titanium dioxide (TiO2) and tin oxide (SnO2) are two popular wide band-gap semiconductors for photocatalytic and electronic applications such as solar cells, optoelectronic devices, and lithium-ion batteries. Nanosized TiO2 structures have strong absorption in the UV region while SnO2 is a powerful transparent conducting oxide. Composites of TiO2 and SnO2 are especially attractive since they form a type-II heterojunction extending the lifetime of charge carriers and enhancing photoconversion efficiency. In this study, the synthesis of TiO2 nanoparticles as well as their uniform and controlled coating with SnO2 shells are described, providing the first utilization of sodium stannate to grow SnO2 shells on a metal-oxide core. The step-growth method utilized here shows the ability to vary the shell thickness between 5-40 nm while maintaining uniformity of the shell. As such, the complete synthesis route involves facile and reproducible surfactant-free solution-based methods at moderate temperatures. The nanoparticles were characterized using scanning electron microscopy (SEM), transmission electron microscopy (TEM), X-ray photoelectron spectroscopy (XPS), energy-dispersive X-ray spectroscopy (EDX), and X-ray diffraction (XRD). Overall, this paper represents reliable nanoscale fabrication techniques offering key advancements in photovoltaic and optoelectronic applications.
Keywords: TiO2, SnO2, Heterojunction, Core-shell, Nanoparticles, Wide Band-gap Semiconductor
Introduction
Metal oxides have emerged as an important class of compounds for photovoltaics, optoelectronics, and photocatalysis [1-9]. Metal oxide semiconductors with a wide band gap (2-4 eV) have been used for the fabrication of solar cells, lithium-ion batteries, thin-film transistors (TFTs), piezoelectric devices, light-emitting diodes (LEDs), integrated circuits, chemical sensors, and biosensors [1-7,10]. The fabrication of nanoscale colloidal particles of metal oxides is important to improve cost-efficiency and to enhance our ability to control optical and electrical properties at the nanoscale [8]. In recent times, metal oxide nanoparticles have been shown to be effective materials for photocatalytic and photovoltaic applications via the utilization of solar energy [5,8]. The band energies of the metal oxides play a critical role in the design of effective photocatalysts and photovoltaic solar cells. Among the metal oxides, titanium dioxide (TiO2) is the most widely investigated metal oxide photocatalyst due to its relatively low cost, high absorption, low toxicity, and stability [11]. However, TiO2 suffers from poor quantum yields caused by rapid recombination of photogenerated electrons and holes [11-13]. In recent times, nanoscale metal oxide heterojunctions have garnered special attention due to the ability to compensate for the electronic limitations of metal oxides. The band energies of the metal oxides can be aligned with others to promote specific electronic processes, while suppressing others. The SnO2/TiO2 heterojunction has emerged as a powerful system to enhance the properties of either oxide in photocatalytic and photovoltaic applications [14-17].
SnO2 and TiO2 have similar crystal structures (rutile and anatase) with comparable lattice constants (a = 4.5–4.8 A˚, c = 2.9–3.2 A˚ for rutile; a = 3.7–4.0 A˚, c = 9.6–10.2 A˚ for anatase) and comparable band gaps (~3.2–3.6 eV) [18]. However, these structural similarities do not translate to similarities in their optical and electronic properties. On analyzing the electronic structure of the two oxides, their photovoltaic compatibility becomes evident. TiO2 shows several energetically flat and close-lying levels in the conduction band (CB). SnO2, on the other hand, has a single highly dispersive level in its CB [18]. As a consequence, TiO2 favors a much stronger optical absorption in the UV, while SnO2 is a much better conductor of the electrons in its CB. More importantly, the combination of SnO2 and TiO2 form a type-II heterojunction. The CB of TiO2 is positioned above the CB of SnO2, while the valence band (VB) of TiO2 is energetically positioned between the VB and CB of SnO2 [19]. As a consequence of this staggered conformation of energy levels, the CB of SnO2 acts as a sink for photogenerated electrons from TiO2, while the photogenerated holes of SnO2 move in the opposite direction and accumulate in the VB of TiO2. These phenomena lead to an excitonic charge separation state that prolongs the lifetime of the charge carriers [20]. These features make the TiO2/SnO2 core-shell heterojunction extremely effective for dye-sensitized solar cells and photoelectrochemical cells [14-16]. Electron trapping in the CB of SnO2 also leads to effective inhibition of back-electron transfer (BET) between the oxidized dye and reduced semiconductor in dye-sensitized solar cells [14-16].
Until now, such TiO2/SnO2 heterojunctions have been mostly generated in thin films, nanofibers, and nanowire arrays – structures that lack morphological uniformity on the nanoscale [19,21]. Herein, we describe a controllable strategy to synthesize this heterojunction in a colloidal nanoparticle. The nanoparticles reported herein employ a SnO2 coating around a TiO2-based core, which can concentrate electrons on the surrounding SnO2 shell, making them more effective as photocatalysts. The ability to fabricate SnO2 layers with varying thickness on TiO2 nanoparticles adds a degree of control at the nanoscale never achieved before in such systems and allows us to fine-tune the optical and electrical properties on the nanoscale. All the nanoparticles were characterized by scanning electron microscopy (SEM), transmission electron microscopy (TEM), energy-dispersive X-ray spectroscopy (EDX), X-ray photoelectron spectroscopy (XPS), and X-ray diffraction (XRD).
Materials and Methods
Materials
Titanium nitride (TiN) and sodium stannate trihydrate (Na2 SnO3.3H2O) were purchased from Sigma-Aldrich and used without further purification. Hydrogen peroxide (H2 O2, 30%, Macron Fine Chemicals), ammonium hydroxide (NH4 OH, 28–30%, VWR Analytical) and ethanol (EtOH, anhydrous, Flinn Scientific) were purchased from the indicated suppliers and used without modification. Water was purified to a resistance of 18 MΩ-cm (Academic Milli-Q Water System, Millipore Corporation). All glassware and reaction vessels used during the experiments was cleaned twice in an aqua regia solution (3:1 HCl: HNO3), rinsed with water and acetone, and then dried in the oven prior to each use. After repeated use, the glassware was also occasionally cleaned in a base bath followed by piranha solution (3:1 H2 SO4:H2 O2) and then again by aqua regia.
Characterization Methods
A LEO-1525 scanning electron microscope (SEM) was used to image the nanoparticles with an accelerating voltage of 15 kV. All SEM samples were prepared by depositing on a silicon wafer, pre-cleaned with water and ethanol. Size distribution analysis was performed based on SEM images of 50 nanoparticles for each sample using ImageJ, to determine the average diameters. Shell thicknesses were calculated using equation 1; where DAvg(core-shell) = average diameter for TiO2 @SnO2 nanoparticles and DAvg(core) = average diameter of TiO2 nanoparticles:
Shell thickness = DAvg(core-shell)- DAvg(core) /2 (1)
The nanoparticles were also imaged using a JEM-2010 FX transmission electron microscope (TEM) and operating at an accelerating voltage of 200 kV. All TEM samples were deposited on 300 mesh holey carbon-coated copper grids and dried overnight before analysis. Energy-dispersive X-ray spectroscopy (EDX) data were collected by an EDX attached to the JEM-2010 TEM instrument, providing the elemental composition of the particles. X-ray diffraction (XRD) patterns for the nanoparticles were obtained using a X'PERT PRO PANalytical X-ray diffractometer. A glass slide was cleaned with piranha and a concentrated sample of the nanoparticles in water was deposited onto the cleaned glass slides. The XRD data were obtained using Cu Kα radiation over the 2θ range of 10°–80° over 15 minutes. A PHI 5700 X-ray photoelectron spectrometer X-ray photoelectron was used to collect spectroscopy (XPS) data. A monochromatic Al Kα source with 10 mA emission current and 15kV emission bias was used as the measurement parameters. Concentrated samples of the nanoparticles in water were dropped on copper-tape-covered silicon wafers. Before sample preparation, the copper-tape-covered slides were washed with Milli-Q water followed by ethanol and dried with nitrogen gas. UV-Vis extinction spectra were obtained using a Cary 50 Scan UV-vis spectrometer.
Synthesis of TiO2 Nanoparticles (TiO2 NPs)
The first step in the synthesis of TiO2 nanoparticles involved the preparation of a Ti-peroxo complex. Specifically, the TiN (0.10 g) was dispersed in 100 mL of Millipore water followed by the addition of 10 mL of 30% hydrogen peroxide (H2 O2) and 10 mL of 25% ammonia solution. A transparent yellow solution of Ti-peroxo complex was obtained after 2 h of stirring at room temperature. An aliquot of the Ti-peroxo complex solution was mixed with ethanol (1:2 volume ratio) under vigorous stirring at 80 °C. After heating for 20 h, the solution was cooled to room temperature and centrifuged to collect a white precipitate of amorphous TiO2 particles. The precipitate was washed with ethanol and redispersed in 30 mL of ethanol. Anatase phase TiO2 nanoparticles were obtained by hydrothermal heating of the dried nanoparticles in a Teflon-lined autoclave at 200 ºC for 24 h. These particles were also later collected by centrifugation and redispersed in an equivalent amount of ethanol as the starting solution.
Synthesis of SnO2-Coated TiO2 Nanoparticles – Routes A, B, C (TiO2 @SnO2-A/B/C)
For Route A, in a 20-mL glass vial, 1 mL of TiO2 NPs from the previous step (~0.004 g of TiO2 NPs) were taken as is, and 9 mL of Milli-Q water was added. The solution was sonicated in an ultrasonic bath for 10 min. The reaction mixture was then heated to 80 ºC. Subsequently, 1 mL of a 0.04 M sodium stannate solution was added to the vial, and the reaction was continued at 80 ºC for 20 min to generate the sample TiO2 @SnO2-A. The nanoparticles were collected by centrifugation at 6000 rpm for 20 min, the supernatant was discarded to remove any remaining water and then finally redispersed in 1 mL of Milli-Q water.
Similarly for Route B, 1 mL of TiO2 NPs from the previous step (~0.004 g of TiO2 NPs) were taken as is, and 9 mL of Milli-Q water was added. After sonication for 10 min, the reaction mixture was heated to 80 ºC. Subsequently, 1 mL of a 0.2 M sodium stannate solution was added to the vial, and the reaction was continued at 80 ºC for 20 min to generate the sample TiO2@SnO2-B.
For Route C, in a 20-mL glass vial, 1 mL of TiO2 NPs (~0.004 g of TiO2 NPs) from the previous step were taken as is, and 4 mL of Milli-Q water was added. After sonication for 10 min, the reaction mixture was heated to 80 ºC. Subsequently, 1 mL of a 0.08 M sodium stannate solution was added to the vial, and the reaction was continued at 80 ºC for 20 min to generate the sample TiO2@SnO2-C.

Scheme 1. Synthesis Route for the Synthesis of TiO2 @SnO2 Core-Shell Nanoparticles.
Synthesis of SnO2-Coated TiO2 Nanoparticles – Route D (TiO2 @ SnO2-D)
In a 20-mL glass vial, 1 mL of TiO2 NPs from the previous step (~0.004 g of TiO2 NPs) were taken as is, and 4 mL of Milli-Q water was added. The solution was sonicated in an ultrasonic bath for 10 min. The reaction mixture was then heated to 80 ºC. Subsequently, 200 µL of a 0.04 M sodium stannate solution was added to the vial, and the reaction was continued at 80 ºC for 20 min to generate the sample TiO2 @SnO2-D1. To synthesize TiO2@SnO2-D2, another 200 µL of a 0.04 M sodium stannate solution was added to the vial, and the reaction was continued at 80 ºC for an additional 20 min. This addition process was repeated for three times to generate TiO2 @ SnO2-D3, TiO2 @SnO2-D4, and TiO2@SnO2-D5, respectively. The target sample was extracted by centrifugation at 6000 rpm for 20 min, the supernatant was discarded to remove any remaining water and then finally redispersed in 1 mL of Milli-Q water.
Synthesis of SnO2-Coated TiO2 Nanoparticles – Route E (TiO2@SnO2-E)
In a 20-mL glass vial, 1 mL of TiO2 NPs from the previous step (~0.004 g of TiO2 NPs) were taken as is, and 4 mL of Milli-Q water was added. The solution was sonicated in an ultrasonic bath for 10 min. The reaction mixture was then heated to 80 ºC. Subsequently, 200 µL of a 0.08 M sodium stannate solution was added to the vial, and the reaction was continued at 80 ºC for 20 min to generate the sample TiO2 @SnO2-E1. To synthesize TiO2@SnO2-E2, another 200 µL of a 0.08 M sodium stannate solution was added to the vial, and the reaction was continued at 80 ºC for an additional 20 min. This addition process was repeated for three times to generate TiO2@SnO2-E3, TiO2@SnO2-E4, and TiO2 @SnO2-E5, respectively. The target sample was extracted by centrifugation at 6000 rpm for 20 min, the supernatant was discarded to remove any remaining water, and then finally redispersed in 1 mL of Milli-Q water.
Synthesis of SnO2-Coated TiO2 Nanoparticles – Route F (TiO2@SnO2-F)
In a 20-mL glass vial, 1 mL of TiO2 NPs from the previous step (~0.004 g of TiO2 NPs) were taken as is, and 4 mL of Milli-Q water was added. The solution was sonicated in an ultrasonic bath for 10 min. The reaction mixture was then heated to 80 ºC. Subsequently, 1 mL of a 0.04 M sodium stannate solution was added to the vial and the reaction was continued at 80 ºC for 20 min. This generates the sample TiO2 @SnO2-F1. To synthesize TiO2 @SnO2-F2, another 1 mL of a 0.04 M sodium stannate solution was added to the vial and the reaction was continued at 80 ºC for an additional 20 min. This addition process was repeated for three times to generate TiO2 @ SnO2-F3, TiO2 @SnO2-F4, and TiO2 @SnO2-F5, respectively. The target sample was extracted by centrifugation at 6000 rpm for 20 min, the supernatant was discarded to remove any remaining water and then finally redispersed in 1 mL of Milli-Q water.
Results And Discussion
Synthesis and Morphological Study of the Nanoparticles
TiO2 Nanoparticles (TiO2 NPs)
Titanium dioxide nanoparticles were synthesized according to a previously reported method [22]. Briefly, TiN was oxidized by H2 O2 and treated under alkaline conditions to yield a stable Ti precursor in the form of a Ti-peroxo complex [Ti(OH)3 O2]-. This Ti-peroxo complex slowly precipitated as TiO2 seeds in ethanol, which then grew to form TiO2 nanoparticles. The SEM image in Figure 1a shows that the final TiO2 nanoparticles are spherical and well dispersed. Size distribution analysis showed the average diameter of the nanoparticles to be 116 ± 43 nm.
SnO2-Coated TiO2 Nanoparticles (SnO2@TiO2)
After the successful synthesis of the TiO2 NPs, tin oxide shells were grown around these nanoparticles, as outlined in Scheme 1. The synthesis strategy to grow the SnO2 shells is loosely based on the method reported by Medhi et al [23]. The SnO2 shells were formed by using an aqueous sodium stannate trihydrate precursor solution. SnO2 can be spontaneously formed from an aqueous solution of sodium stannate when the pH is lowered to < 11 [24-26]. Crystalline SnO2 is the most stable phase at pH values under 11.7 [25]. The pH was controlled by heating the temperature of the reaction mixture containing the nanoparticle cores to 80 ºC [26]. The addition of aqueous sodium stannate solution to this reaction mixture led to the spontaneous formation of SnO2 crystallites around the TiO2 NPs.
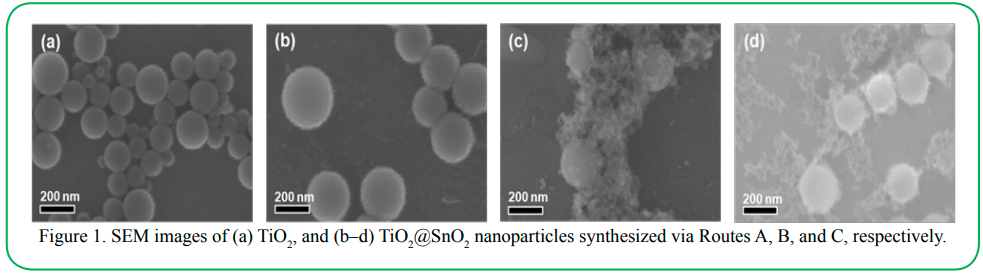
Figure 1. SEM images of (a) TiO2, and (b–d) TiO2 @SnO2 nanoparticles synthesized via Routes A, B, and C, respectively.
It is important to note that, in the absence of a nanoparticle core, the sodium stannate crystallizes to form free SnO2 nanoparticles with diameters of ~30 nm [24]. Hence, it is important to adjust the concentration of the nanoparticle core and the precursor feed. In this study, a variety of reaction conditions were explored. In the first iteration (Route A), 1 mL of TiO2 NPs was diluted to 10 mL, heated to 80 ºC, and 1 mL of 0.04 M sodium stannate solution was added at once and allowed to react for 20 min. No tin oxide shells were observed in the SEM images, as shown Figure 1b. In the second iteration (Route B), 1 mL of TiO2 NPs was similarly diluted to 10 mL, and 1 mL of a more concentrated 0.2 M sodium stannate solution was added. In this case, many free SnO2 NPs were obtained, with a limited number of SnO2 crystallites forming shells around the TiO2 NPs (see Figure 1c). In the third iteration (Route C), the 1 mL of TiO2 NP solution was diluted to just 5 mL, and 1 mL of 0.08 M sodium stannate solution was added. The doubled concentration of TiO2 nanoparticle cores was anticipated to facilitate the localization of SnO2 crystallites at the surface of the TiO2 cores. Although the number of free SnO2 NPs decreased, there was still no significant shell growth on the surface of the TiO2 NPs (see Figure 1d). Typically, in previous studies with metal nanoparticle cores, sodium stannate has been added in a single injection [23,27]. The sodium stannate has been observed to preferentially crystallize as SnO2 on the surface of Au NPs. However, the Au NPs in those studies were stabilized by citrate ions, which have an affinity towards SnO2 and most likely assist the localization of the initial SnO2 crystallites on the surface of the Au NPs and subsequent growth of a complete SnO2 shell. However, the TiO2 NPs in the present study were not stabilized by any surfactant or ligand. Thus, the TiO2 NP core surface lacks any inherent affinity to localize the SnO2 crystallites. A different approach is therefore required for the controlled growth of SnO2 shells on these TiO2 cores.
In the fourth iteration (Route D), the 1 mL of TiO2 NPs were diluted to 5 mL, and 1 mL of 0.08 M sodium stannate solution was added in five different steps of 200 µL each and stirred for 20 min at 80 ºC for each step. The SEM images of the nanoparticles after each stepwise reaction are presented in Figure 2. As illustrated in the SEM images in Figure 2, no significant shell growth was observed till the third step (a total 0.6 mL of 0.08 M sodium stannate), although no free SnO2 NPs were observed either. After the fourth step, the surface of the initially smooth TiO2 NPs begins to become rugged due to the growth of SnO2 crystallites, as shown in Figure 2e. Size distribution analysis shows a shell thickness of 4 ± 2 nm. The SEM image of the nanoparticles after the fifth step of sodium stannate addition is mostly like the fourth step, with the appearance of rugged surfaces indicating the growth of an SnO2 shell (see Figure 2f). Size distribution analysis showed a calculated shell thickness of 12 ± 7 nm. Notably, the total amount of sodium stannate added after the fifth step in Route A was the same as Route C (total 1 ml of 0.08 M), but the stepwise addition significantly reduced the number of free tin oxide nanoparticles in solution (see Figures 1d and 2f).
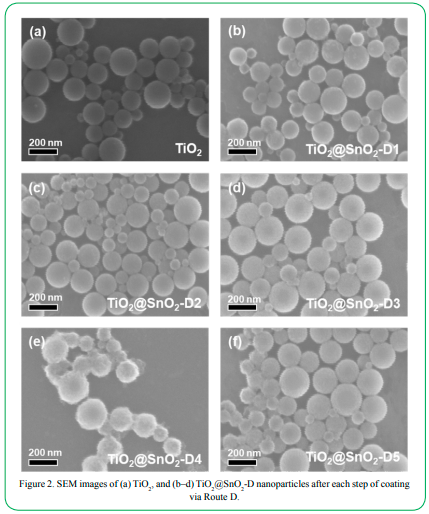
Figure 2. SEM images of (a) TiO2, and (b–d) TiO2@SnO2-D nanoparticles after each step of coating via Route D.
To increase the thickness of the SnO2 shell, the fifth iteration (Route E) utilized 1 mL of TiO2 NPs diluted to 5 mL and 1 mL of 0.04 M sodium stannate solution was added in five different steps of 200 µL each, and stirred for 20 min at 80 ºC for each step. As shown in the SEM images in Figure 3b, no significant shell growth was observed after the first step. However, after the second step, the SnO2 shell was discernable on the surface of the TiO2 NPs, which corresponds well with TiO2 @SnO2-D4, which utilized equivalent moles of sodium stannate. Although this iteration uses more concentrated solution of sodium stannate, no free SnO2 nanoparticles were observed. The calculated shell thickness of 9 ± 4 nm is greater than that observed for TiO2 @SnO2-D4 (4 ± 2 nm). The SnO2 shells became thicker and more evident with each subsequent step of adding 0.04 M sodium stannate as observed with TiO2 @SnO2-E3, TiO2@SnO2-E4, and TiO2 @SnO2 -E5 in Figures 3d–f, with a shell thickness of 12 ± 1 nm,30 ± 5 nm, 30 ± 3 nm, respectively. Notably, with this stepwise addition, no free SnO2 NPs were observed after adding the full 1 mL of 0.04 M sodium stannate, which is a stark difference to adding the same and even smaller amounts of sodium stannate in the first and third iterations (Routes A and C). As such, this route outlines a reliable strategy to localize the growth of SnO2 shells on TiO2 cores. Moreover, to our knowledge, this is the first time a SnO2 shell has been synthesized with a thickness >20 nm. Typically, due to the single-injection method employed previously, attempts to increase shell thickness by increasing the concentration of sodium stannate precursor spontaneously led to the formation of free SnO2 NPs instead of increased shell thicknesses.
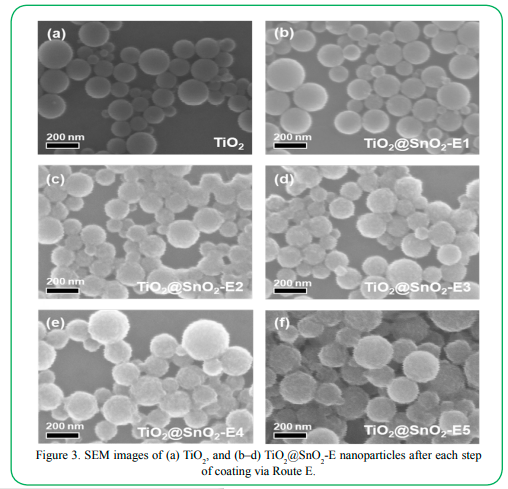
Figure 3. SEM images of (a) TiO2, and (b–d) TiO2@SnO2-E nanoparticles after each step of coating via Route E.
To explore if the shell thickness could be further increased, the sixth iteration (Route F) utilized 1 mL of TiO2 NPs diluted to 5 mL, and 5 mL of 0.04 M sodium stannate solution was added in five different steps of 1 mL each and stirred for 20 min at 80 ºC for each step. At the first step, the amount of sodium stannate added was the same as that used for TiO2 @SnO2-E5. Although no free SnO2 NPs were observed, the SnO2 shells on the surface of the TiO2 in TiO2 @SnO2-F1 (Figure 4b) do not appear as thick as those in TiO2@SnO2-E5 (Figure 3f). Size analysis confirmed this observation with a shell thickness of 14 ± 5 nm, considerably lower than the 30 ± 5 nm observed for TiO2@SnO2-E5. After the second step of addition, the SnO2 shells became considerably thicker around the TiO2 cores (Figure 4c), with a thickness of 42 ± 4 nm. The shells appear to further increase in thickness after the third step (Figure 4d), although one can observe a tendency to form bridges consisting of SnO2 particulates between the coated nanoparticles. However, the excess SnO2 crystallites appeared to grow as extensions from the shells rather than as free SnO2 NPs growing from solution as observed with Routes A, B, and C. This trend continued in the fourth and fifth step (Figures 4e,f), wherein the excess SnO2 crystallites progressed from forming bridges to forming a full network mesh of SnO2 engulfing the embedded TiO2 NPs.
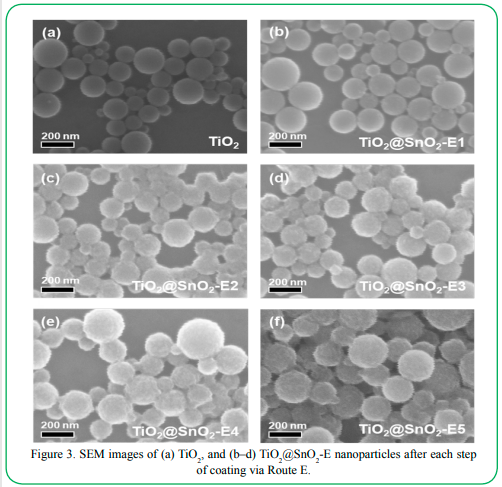
Figure 4. SEM images of (a) TiO2, and (b–d) TiO2@SnO2-E nanoparticles after each step of coating via Route E.
The SEM results above for the TiO2@SnO2-E5 nanoparticles demonstrated the most effective shell growth without forming any bridges, webs, or free SnO2 nanoparticles. This sample was further analyzed by TEM imaging to observe the shell thickness and crystalline composition. The TEM images in Figure 5a and 5b shows the SnO2 shell comprised of minute polycrystallites. This polycrystalline porous nature of the shell is consistent with SnO2 synthesized using the sodium stannate method [23-24,27]. The TEM image in Figure 5a also confirmed that the formation of free SnO2 nanoparticles was limited.

Figure 5.TEM images of TiO2@SnO2-E5 nanoparticles after the fifth step of coating via Route E.
As a whole, these results indicate that once the initial SnO2 crystallites are localized on the surface of the core NPs, the subsequent crystallites also prefer to grow near these initial crystallites forming a shell rather than free nanoparticles in solution. As such, this method establishes a key principle for the controlled growth of SnO2 shells of varying thicknesses around unfunctionalized TiO2 NP cores. Previously, the only method to control SnO2 thickness was to change the amount of sodium stannate solution, with thicknesses varying between 5–12 nm. Even on citrate-stabilized Au NPs, the addition of any more sodium stannate drastically increased the number of free tin oxide NPs while only increasing the shell thickness marginally. Using the step-growth method outlined here should enable the growth of thicker shells in a more controlled fashion even on metal nanoparticle cores.
Structural Analysis of the Nanoparticles
Powder XRD analysis was conducted to determine the phases present in the nanoparticles. For the XRD studies, TiO2 @SnO2-E5 core-shell nanoparticles were synthesized starting with the hydrothermal heat-treated anatase TiO2 core, since the as-synthesized TiO2-coated nanoparticles show no peaks for TiO2. In contrast, the XRD pattern for the final core-shell nanoparticles in Figure 6 shows the peaks corresponding to the anatase phase of TiO2 (JCPDS 21-1272) [28]. The peaks at 2θ = 25.38, 48.05, 53.95, 55.04, 62.85, and 75.12 respectively correspond to the (101), (200), (105), (211), (204), and (215) planes for anatase TiO2[29]. Hydrothermal treatment is a standard procedure to achieve anatase phase TiO2 [30]. Interestingly, the SnO2 shells grown atop the anatase TiO2 layer adopt the rutile phase [23-24]. The (110), (101), and (211) peaks observed for the nanoparticles with a SnO2 coating at 2θ = 26.28, 33.71, and 58.51 are characteristic of SnO2 nanoparticles prepared using this method [23-24].

Figure 6. Powder XRD pattern for TiO2 @SnO2-E5 nanoparticles.
Compositional Analysis of the Nanoparticles
Analysis by XPS was performed to determine the elemental composition on the surface of the nanoparticles at each step of the synthetic process. Figure 7 shows the changes in the elemental composition of the surface after coating with a SnO2 shell. A broad peak at 532 eV for oxygen was observed in the O 1s spectra which is consistent with metal oxides [31]. The peaks for Sn 3d5/2 and 3d3/2 at 486.0 eV and 494.5 eV, respectively, can be observed, which confirms the presence of SnO2 [24]. As such, peaks corresponding to Ti 2p3/2 and 2p1/2 at 459.0 eV and 464.3 eV, respectively appear even in the coated sample, although the intensity is low [32-33]. It is important to note that XPS is a surface-specific technique and provides the composition at the outer surface of the nanoparticles [34-35]. The intensity for these Sn 3d peaks is much stronger than the Ti 2p peaks, confirming the successful growth of SnO2 shells encapsulating the TiO2 cores. The relative atomic concentrations of all the elements are presented in Figure 7. Even though the relative amount of TiO2 in the nanoparticles was higher than SnO2(as confirmed by the SEM and TEM images of the core-shell structures and the EDX spectra; vide infra) the relative atomic concentrations derived by XPS were dominated by Sn (13%) vs Ti (7%), which confirmed successful shell growth.

Figure 7. XPS spectra for (a) O 1s region, (b) Sn 3d region, and (c) Ti 2p region for the TiO2 @SnO2-E5 nanoparticles.
In addition to XPS, we also performed EDX analysis to further confirm the overall composition of the nanoparticles. Figure 8 shows the EDX spectra for the final core-shell nanoparticle after five rounds of SnO2 coating via Route E. The SEM-EDX spectra show that the nanoparticles contained peaks characteristic for Ti Lα, Kα, and Kβ at 0.45 eV, 4.51 eV, and 4.93 eV, respectively. The characteristic peak for O Kα at 0.53 eV was also visible. The nanoparticles also exhibited the peaks for Sn Lα and Kα at 3.44 eV and 25.27 eV, respectively, arising from the SnO2 shell. The atomic concentrations obtained from the EDX measurements are listed in Figure 8. Oxygen dominated the spectra with 86% relative concentration, while Ti constituted 11% and Sn constituted 3%. The relative atomic concentrations of titanium were markedly higher in the EDX measurements compared to the XPS measurements (which mainly probe the surface composition corresponding to the SnO2 shell). These results further confirm that the TiO2 cores are covered by SnO2 shells. The overall relative concentrations of Ti and Sn from EDX also roughly matched the relative dimensions occupied by their corresponding phases in the respective nanoparticle architectures as evaluated from the SEM and TEM images.
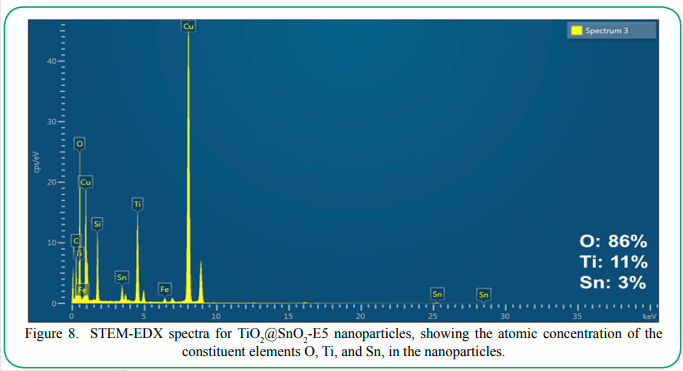
Figure 8. STEM-EDX spectra for TiO2 @SnO2-E5 nanoparticles, showing the atomic concentration of the constituent elements O, Ti, and Sn, in the nanoparticles.
In addition to EDX spectroscopy, we also conducted elemental mapping using STEM-EDX to determine the distribution of the elements within the nanoparticles and confirm the core-shell structure. As illustrated in Figure 9, titanium was confined only to the inner regions of the nanoparticles. The distribution of oxygen and tin extended to wider dimensions that covered more of the nanoparticle volume, indicating encapsulation of the TiO2 cores in the nanoparticles. Figure 9 also shows that the distribution of tin extended the widest across the nanoparticle volume, indicating that this element constituted the outermost shell. The oxygen distribution also paralleled the tin distribution, which is consistent with the presence of a SnO2 shell.
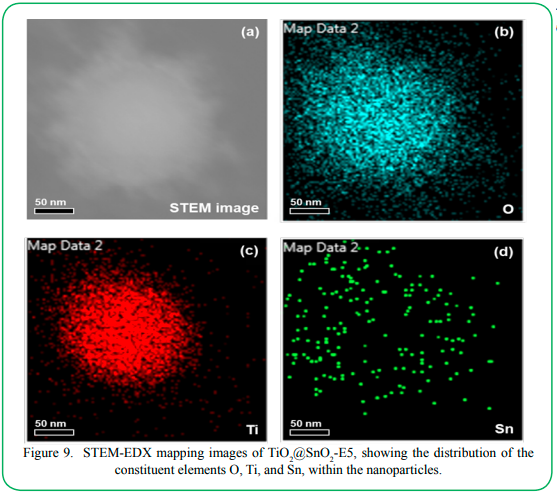
Figure 9. STEM-EDX mapping images of TiO2 @SnO2-E5, showing the distribution of the constituent elements O, Ti, and Sn, within the nanoparticles.
The SEM, XPS, and EDX results confirmed the successful growth of SnO2 shells around the TiO2 cores. This composite design can facilitate the movement of electrons from the CB of TiO2 in the core to the CB of the SnO2 shell, concentrating electrons in the outermost layer. Meanwhile, the holes from the VB of SnO2 can move in the opposite direction toward the VB of TiO2, effectively increasing the separation of charge carriers and extending their lifetime. Given the polycrystalline porous nature of the SnO2 shells and their transparency to visible light, all parts of the nanoparticle are accessible: photons and chemical species in solution can easily access both the core and the shell parts of the nanoparticle. In a previous report, [23] we demonstrated the ability to modify the GS-NS@SnO2 recipe to generate tin oxide shells doped with antimony and zinc simply by adding sodium antimonate and sodium zincate to the reaction mixture after the initial formation of SnO2 seeds from sodium stannate. This strategy allows careful tuning of the conductivity, band gap, as well as the crystallinity of the semiconducting tin oxide shell in the core-shell TiO2 @SnO2 nanoparticle system reported herein.
Optical Properties:
The optical properties were analyzed using UV-visible spectroscopy. Anatase TiO2 has an optical band gap of ~3.2 eV while rutile SnO2 has a band gap of 3.6-3.8 eV [8]. Notably, the UV absorption from TiO2 is significantly more intense than that from SnO2, as reported from theoretical calculations in previous literature [18]. A such, the UV-Vis spectra largely retain the features of TiO2 core nanoparticles after coating with the SnO2 shell (see Figure 10). This result is also expected since the TiO2 core is large (116 ± 43 nm) and is the major component even in the coated nanoparticles. However, the absorption increases at the lower wavelengths due to the contribution from the SnO2 shell. Since both the band-gap and absorption of SnO2 are lower than those of TiO2, the band edge also is not affected after coating with SnO2. These observations indicate that Sn is not doped into the TiO2 structure, but forms a separate SnO2 phase instead, consistent with the XRD data. Notably, Meyer et al. have previously shown the possible formation of a mixed Snx Tiy Oz interlayer between the TiO2 and SnO2 phases in the photoexcited state [15,36]. However, the dimensions of such an interlayer would be extremely small compared to the overall particle size. As such, any additional band-edge features would be negligible compared to the band gaps of the bulk phases and thus would not be observable in our UV-Vis spectra. Ultimately, further investigation using transient absorption spectroscopy and spectro-electrochemical studies can be undertaken to help elucidate the exact electronic mechanisms at the TiO2/SnO2 heterojunction.
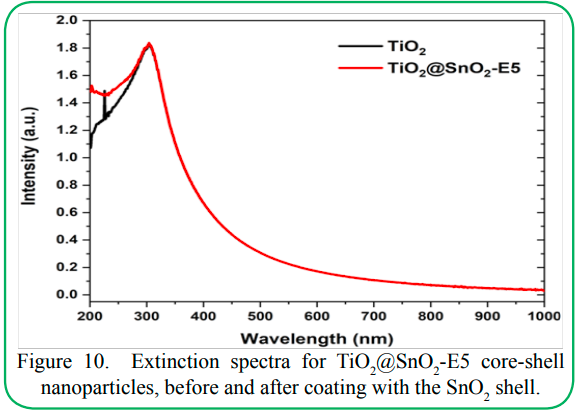
Figure 10.Extinction spectra for TiO2 @SnO2-E5 core-shell nanoparticles, before and after coating with the SnO2 shell.
Conclusions
We demonstrated for the first time a strategy to fabricate type-II heterojunction of TiO2 and SnO2 in a core-shell nanoparticle system. The synthesis method utilizes a facile surfactant-free sodium stannate method to coat SnO2 shells at ambient conditions on a metal oxide core. The synthesis method presents an effective strategy to localize SnO2 crystallites on the surface of the TiO2 cores and control the thickness of the SnO2 shells between 5–40 nm, while limiting the formation of free SnO2 nanoparticles. The synthesis method can also be adapted to synthesize thicker shells on metal cores, as well as embed nanoparticle cores within a network mesh of polycrystalline SnO2 nanoparticles. The synthesis protocol can also be easily adapted to synthesize antimony- and zinc-doped tin oxide shells as shown in a previous study [23], providing the ability to further tune the electrical properties of the nanoscale heterojunction. The ability to fabricate the vital TiO2 @SnO2 heterojunction in a colloidal nanoparticle allows utilization of their electrical properties in solution, in suspensions, dispersed in a matrix, or deposited as colloidal thin films. The SnO2 shells are also expected to enhance the lifetime of photogenerated charge carriers in TiO2, and vice versa. Combined with the ability to controllably vary the SnO2 shell thickness [37] and to modulate the band gap of SnO2 via doping,[23,24] this versatile SnO2 coating method affords multiple handles to tune the electrical properties of semiconducting nanoparticles. On the whole, a combination of these optical and electrical properties should render these unique hybrid particles effective materials for photovoltaics, photocatalysis, optoelectronic devices, sensors, and Li-ion batteries.
ORCID
Riddhiman Medhi: 0000-0002-2368-2468 Nhat Ngo: 0000-0001-5710-1601 Tai-Chou Lee: 0000-0002-1695-1201 T. Randall Lee: 0000-0001-9584-8861
Acknowledgement
We thank the Air Force Office of Scientific Research (AFOSR FA9550-20-1-0349; 20RT0302), the Robert A. Welch Foundation (Grant Nos. E-1320), and the Texas Center for Superconductivity for generously supporting this research.
Competing interests:
The authors report no conflict of interest.
References
Dey, A. (2018). Semiconductor Metal Oxide Gas Sensors: A Review. Mater. Sci. Eng., B, 229 206–217.View
Ray, C.; Pal, T. (2017). Recent Advances of Metal–Metal Oxide Nanocomposites and their Tailored Nanostructures in Numerous Catalytic Applications. J. Mater. Chem. A, 5 (20), 9465–9487.View
Yu, X.; Marks, T. J.; Facchetti, A. (2016). Metal Oxides for Optoelectronic Applications. Nat. Mater., 15 383.View
Liu, Y.; Wang, W.; Xu, X.; Marcel Veder, J.-P.; Shao, Z. (2019). Recent Advances in Anion-Doped Metal Oxides for Catalytic Applications. J. Mater. Chem. A, 7 (13), 7280–7300.View
Raghunath, A.; Perumal, E. (2017). Metal Oxide Nanoparticles as Antimicrobial Agents: A Promise for the Future. Int. J. Antimicrob. Agents, 49 (2), 137–152.View
Daghrir, R.; Drogui, P.; Robert, D. (2013). Modified TiO2 For Environmental Photocatalytic Applications: A Review. Ind. Eng. Chem. Res., 52 (10), 3581–3599.View
Ganguly, A.; Anjaneyulu, O.; Ojha, K.; Ganguli, A. K. (2015). Oxide-Based Nanostructures for Photocatalytic and Electrocatalytic Applications. CrystEngComm, 17 (47), 8978– 9001.View
Medhi, R.; Marquez, M. D.; Lee, T. R. (2020). Visible-Light-Active Doped Metal Oxide Nanoparticles: Review of their Synthesis, Properties, and Applications. ACS Appl. Nano Mater., 3 (7), 6156–6185
Chen, Y.-T.; Medhi, R.; Nekrashevich, I.; Litvinov, D.; Xu, S.; Lee, T. R. (2018). Specific Detection of Proteins Using Exceptionally Responsive Magnetic Particles. Anal. Chem., 90 (11), 6749–6756.View
Yi, Z.; Han, Q.; Zan, P.; Cheng, Y.; Wu, Y.; Wang, L. (2016). Facile fabrication of SnO2 @TiO2 core–shell structures as anode materials for lithium-ion batteries. J. Mater. Chem. A, 4 (33), 12850–12857.View
Mazierski, P.; Mikolajczyk, A.; Bajorowicz, B.; Malankowska, A.; Zaleska-Medynska, A.; Nadolna, J. (2018). The Role of Lanthanides in TiO2-Based Photocatalysis: A Review. Appl. Catal. B-Environ., 233 301–317.View
Li, C.-H.; Li, M.-C.; Liu, S.-P.; Jamison, A. C.; Lee, D.; Lee, T. R.; Lee, T.-C. (2016). Plasmonically Enhanced Photocatalytic Hydrogen Production from Water: The Critical Role of Tunable Surface Plasmon Resonance from Gold–Silver Nanoshells. ACS Appl. Mater. Interfaces, 8 (14), 9152–9161.View
Ohtani, B. (2013). Titania Photocatalysis beyond Recombination: A Critical Review. Catalysts, 3 (4), 942–953.View
McCool, N. S.; Swierk, J. R.; Nemes, C. T.; Schmuttenmaer, C. A.; Mallouk, T. E. (2016). Dynamics of Electron Injection in SnO2/TiO2 Core/Shell Electrodes for Water-Splitting Dye-Sensitized Photoelectrochemical Cells. J. Phys. Chem. Lett., 7 (15), 2930–2934.View
Troian-Gautier, L.; Sampaio, R. N.; Piechota, E. J.; Brady, M. D.; Meyer, G. J. (2018). Barriers for Interfacial Back-Electron Transfer: A Comparison between TiO2 and SnO2 /TiO2 Core/ Shell Structures. J. Chem. Phys., 150 (4), 041719.View
Gish, M. K.; Lapides, A. M.; Brennaman, M. K.; Templeton, J. L.; Meyer, T. J.; Papanikolas, J. M. (2016). Ultrafast Recombination Dynamics in Dye-Sensitized SnO2/TiO2 Core/ Shell Films. J. Phys. Chem. Lett., 7 (24), 5297–5301.View
Martínez-Denegri, G.; Colodrero, S.; Kramarenko, M.; Martorell, J. (2018). All-Nanoparticle SnO2/TiO2 Electron-Transporting Layers Processed at Low Temperature for Efficient Thin-Film Perovskite Solar Cells. ACS Appl. Energy Mater., 1 (10), 5548–5556.View
Dou, M.; Persson, C. (2013). Comparative Study of Rutile and Anatase SnO2 and TiO2: Band-Edge Structures, Dielectric Functions, and Polaron Effects. J. Appl. Phys., 113 (8), 083703.View
Wang, C.; Shao, C.; Zhang, X.; Liu, Y. (2009). SnO2 Nanostructures-TiO2 Nanofibers Heterostructures: Controlled Fabrication and High Photocatalytic Properties. Inorg. Chem., 48 (15), 7261–7268.View
Huang, X.; Shang, L.; Chen, S.; Xia, J.; Qi, X.; Wang, X.; Zhang, T.; Meng, X.-M. (2013). Type-II ZnO Nanorod–SnO2 Nanoparticle Heterostructures: Characterization of Structural, Optical and Photocatalytic Properties. Nanoscale, 5 (9), 3828–3833.View
Vinodgopal, K.; Bedja, I.; Kamat, P. V. (1996). Nanostructured Semiconductor Films for Photocatalysis. Photoelectrochemical Behavior of SnO2/TiO2 Composite Systems and Its Role in Photocatalytic Degradation of a Textile Azo Dye. Chem. Mater., 8 (8), 2180–2187.View
Khantamat, O.; Li, C.-H.; Liu, S.-P.; Liu, T.; Lee, H. J.; Zenasni, O.; Lee, T.-C.; Cai, C.; Lee, T. R. (2018). Broadening the Photoresponsive Activity of Anatase Titanium Dioxide Particles via Decoration with Partial Gold Shells. J. Colloid Interface Sci., 513 715–725.View
Medhi, R.; Li, C.-H.; Lee, S. H.; Srinoi, P.; Marquez, M. D.; Robles-Hernandez, F.; Jacobson, A. J.; Lee, T.-C.; Lee, T. R. (2020). Antimony- and Zinc-Doped Tin Oxide Shells Coated on Gold Nanoparticles and Gold–Silver Nanoshells Having Tunable Extinctions for Sensing and Photonic Applications. ACS Appl. Nano Mater., 3 (9), 8958–8971.View
Medhi, R.; Li, C.-H.; Lee, S. H.; Marquez, M. D.; Jacobson, A. J.; Lee, T.-C.; Lee, T. R. (2019). Uniformly Spherical and Monodisperse Antimony- and Zinc-Doped Tin Oxide Nanoparticles for Optical and Electronic Applications. ACS Appl. Nano Mater., 2 (10), 6554–6564.View
Rai, D.; Yui, M.; Schaef, H. T.; Kitamura, A. (2011). Thermodynamic Model for SnO2(cr) and SnO2(am) Solubility in the Aqueous Na+–H+–OH––Cl––H2O System. J. Solution Chem., 40 (7), 1155.View
Choi, Y.-I.; Salman, S.; Kuroda, K.; Okido, M. (2013). Synergistic Corrosion Protection for AZ31 Mg Alloy by Anodizing and Stannate Post-Sealing Treatments. Electrochim. Acta, 97 313–319.View
Oldfield, G.; Ung, T.; Mulvaney, P. (2000). Au@SnO2 Core–Shell Nanocapacitors. Adv. Mater., 12 (20), 1519–1522.View
Zhang, D.; Jing, F.; Gao, F.; Shen, L.; Sun, D.; Zhou, J.; Chen, Y.; Ruan, S. (2015). Enhanced Performance of a TiO2 Ultraviolet Detector Modified with Graphene Oxide. RSC Adv., 5 (102), 83795–83800.View
Zhu, H.; Tao, J.; Dong, X. (2010). Preparation and Photoelectrochemical Activity of Cr-Doped TiO2 Nanorods with Nanocavities. J. Phys. Chem. C, 114 (7), 2873–2879.View
Lee, J.-W.; Kong, S.; Kim, W.-S.; Kim, J. (2007). Preparation and Characterization of SiO2/TiO2 Core-Shell Particles with Controlled Shell Thickness. Mater. Chem. Phys., 106 (1), 39– 44.View
Andrulevičius, M.; Tamulevičius, S.; Gnatyuk, Y.; Vityuk, N.; Smirnova, N.; Eremenko, A. (2008). XPS Investigation of TiO2/ZrO2/SiO2 Films Modified with Ag/Au Nanoparticles. Mater. Sci. Medzg., 14 (1), 8–14.View
Sheng, J.; Tong, H.; Xu, H.; Tang, C. (2016). Preparation and Photocatalytic Activity of SnO2@TiO2 Core–Shell Composites Modified by Ag. Catal. Surv. Asia, 20 (3), 167–172.View
Kumar, A.; Rout, L.; Achary, L. S. K.; Mohanty, A.; Dhaka, R. S.; Dash, P. (2016). An Investigation into the Solar Light-Driven Enhanced Photocatalytic Properties of a Graphene Oxide–SnO2–TiO2 Ternary Nanocomposite. RSC Adv., 6 (38), 32074–32088.View
Yang, Z.; Lu, X.; Tan, W.; Zhao, J.; Yang, D.; Yang, Y.; He, Y.; Zhou, K. (2018). XPS Studies of Nitrogen Doping Niobium used for Accelerator Applications. Appl. Surf. Sci., 439 1119– 1126.View
Gilbert, J. B.; Rubner, M. F.; Cohen, R. E. (2013). Depth-Profiling X-Ray Photoelectron Spectroscopy (XPS) Analysis of Interlayer Diffusion in Polyelectrolyte Multilayers. Proc. Natl. Acad. Sci., 110 (17), 6651.View
James, E. M.; Barr, T. J.; Meyer, G. J.(2018). Evidence for an Electronic State at the Interface between the SnO2 Core and the TiO2 Shell in Mesoporous SnO2 /TiO2 Thin Films. ACS Appl. Energy Mater. 1, 859–867.
Srinoi, P.; Marquez, M. D.; Lee, T.-C.; Lee, T. R. (2020). Hollow Gold-Silver Nanoshells Coated with Ultrathin SiO2 Shells for Plasmon-Enhanced Photocatalytic Applications. Materials, 13 (21), 4967.View