
- About the Journal
- Editorial Board
- Review Process
- Author Guidelines
- Article Processing Charges
- Special Issues
- Current Issue
- Past Issue
 Journal of Rehabilitation Practices and Research
Journal of Rehabilitation Practices and Research Volume 7 (2026), Article ID: JRPR-198
https://doi.org/10.33790/jrpr1100198Research Article
Differences in Functional Movement Screen (FMS) Scores Among Distance Runners and Sprinters
Steven Waite1*, Ph.D., CSCS, USAW, Chloe Sharp2, M.S., and Danae Gatewood3
1Assistant Professor of Exercise Science, Department of Kinesiology, Fresno State University, 5241 N Maple Ave, Fresno, CA 93740, United States.
2Assistant Coach, Track & Field, Fresno State University, 5241 N Maple Ave, Fresno, CA 93740, United States.
3Professional Track & Field Athlete, Philippine National Team
Corresponding Author Details: Steven Waite, Ph.D., CSCS, USAW, Assistant Professor of Exercise Science, Department of Kinesiology, Fresno State University, 5241 N Maple Ave, Fresno, CA 93740, United States.
Received date: 10th December, 2025
Accepted date: 10th February, 2026
Published date: 11th February, 2026
Citation: Waite, S., Sharp, C., & Gatewood, D., (2026). Differences in Functional Movement Screen (FMS) Scores Among Distance Runners and Sprinters. J Rehab Pract Res, 7(1):198.
Copyright: ©2026, This is an open-access article distributed under the terms of the Creative Commons Attribution License 4.0, which permits unrestricted use, distribution, and reproduction in any medium, provided the original author and source are credited.
Abstract
The role of exercise screening has become an integral part of athletic development possibly contributing to success in a variety of team and individual sports. There is sufficient evidence supporting the process of exercise screening for identifying potential limitations in muscular flexibility and joint range of motion (ROM) that may have a direct impact on the biomechanics involved in sport performance. Knowing the direct impact effective training modalities can have on musculoskeletal adaptations and overall performance in sport, more attention has been placed on the use of screening exercises such as the Functional Movement Screen (FMS). The FMS utilizes seven exercises involving common movement patterns that are likely to inhibit athletic performance and potentially lead to an increased risk of injury. These inhibiting factors can include a combination of muscular imbalances (i.e., weak muscles), lack of flexibility, and motor development concerns which can inhibit performance in many aspects of sport. The purpose of this study was to utilize the FMS to identify differences in movement patterns between distance runners, sprinters and jumpers involved in a collegiate track program. FMS scores for the distance runners (LD, n = 15) were compared with the sprinters and jumpers (SDJ, n = 15). An analysis between the two groups (n = 30) revealed a significant difference in overall FMS scores (p < .001) as well as three of the lower limb exercises (Deep Squat, p = .040; In-line Lunge, p = .013, & Hurdle Step, p = .015). The results indicate that the SDJ group showed better mobility while the LD group likely suffers from a lack of mobility in the trunk and lower limbs. The lack of mobility in the LD group is likely a result of repetitive movements that can lead to reductions in muscle flexibility and ROM at the joints. Further research is needed to explore the implications of these results and what impact this has on improving performance and reducing the risk of injury.
Keywords: Functional Movement Screen (FMS), Range of Motion (ROM), Muscular Flexibility, Long Distance (LD), Short Distance and Jumpers (SDJ)
Introduction
Improving running economy is a key contributor for improving overall running performance in both short and long-distance runners. Improved running economy is especially important for elite runners who are near their peak capacity for performance and rely on every aspect of training to squeeze the most out of their physiology [1,2]. Improving running economy at the elite level often comes down to very small improvements in performance, which can include improving movement quality as well as other physiological markers [3,4]. Therefore, a lot of attention has been placed on improving training outcomes by screening for movement quality for the purpose of correcting movement patterns that result in improved performance outcomes as well as identifying movement imbalances that could lead to injury [5,6]. It is also well understood that muscular flexibility and joint range of motion (ROM) can have a direct impact on joint function, which can also affect overall performance in running events due to the emphasis placed on form and quality of movement patterns to reduce drag and enhance forward motion [7,8].
There is some discrepancy over the effect of movement patterns on running economy and overall performance [9-11]. As researchers and coaches understand the benefit of training on muscular strength, endurance, and flexibility, more attention has been placed on the use of exercise screening tools to help identify common movement patterns that inhibit performance and potentially lead to injury [5,10]. It is important to note that many inhibiting patterns identified in screening protocols can be an indication of weak muscles, muscular imbalances, and/or poor flexibility, all of which can negatively impact performance and increase the risk of injury [10,12]. The use of movement screening tools, such as the Functional Movement Screen (FMS), may help identify these factors resulting in a potential reduction in movement inequalities and risk stratification [12,13].
Movement economy is often referred to as an athlete’s movement efficiency, which is measured by analyzing movement patterns that effect performance and sport outcomes [2]. Movement efficiency in running events can be the limiting factor or a key contributor to performance, especially in the longer distances due to the impact of incorrect repetitive movement patterns adding up over time [14]. These factors have led to coaches focusing more attention on analyzing the biomechanics of their runners for the sake of improving performance. There are multiple ways to measure movement economy in runners; the FMS has been proved to be a reliable tool used to assess runners of varying levels of performance in recent studies [15,16]. However, there is a lack of substantial evidence supporting the implementation of the FMS in collegiate distance runners and sprinters for the sake of assessing differences in movement efficiency, which is an area that needs to be addressed further [17]. Some research has suggested there are no differences in FMS scores amongst runners competing in similar distances [9,16]. Other evidence suggests that monitoring changes in FMS scores over the duration of a competitive season could indicate trends in performance, which is a potentially useful tool for coaches to utilize in training [18].
The FMS is an assessment tool comprising of seven fundamental movement tests used by health and fitness professionals to identify functional limitations, asymmetries, and weaknesses [19]. The seven exercise tests include the following: Deep Squat, Hurdle Step, In line Lunge, Shoulder Mobility, Active Straight-Leg Raise, Trunk Stability Push-Up, and Rotary Stability. The tool is primarily used to assess common movement patterns that may help to predict injury commonly associated with these particular movement patterns seen in athletes [12]. The tool is also useful in establishing a baseline for movement and to create corrective exercise programs that help monitor improvements over time. The seven exercises involved in the FMS tool assess all areas of the body, which may not directly apply to the performance in every sport-specific setting. However, practitioners can focus on specific exercises to target areas that are necessary for performance in a particular sport of skill. An example would be to focus on the performance of the In-Line Lunge and Hurdle Step tests in runners since these movement patterns directly impact running economy and performance [15]. Regardless, it may be beneficial to look at all movement patterns throughout the body due to the effect of the kinetic chain theory. The kinetic chain theory models the human body as an interconnected system of joints, muscles, and nerves that work together to produce complex movements, where force generated in one segment transfers to others [20].
The reliability of the FMS has also come into question as its gained popularity amongst practitioners across many professions with regard to the assessment of movement and human performance. When using the FMS tool for assessing various athletic populations, multiple studies have shown support for both interrater and intra rater reliability suggesting the use of trained raters will result in much lower variability in scores [21-24]. Interrater reliability has shown to be more consistent when researchers follow the proper protocols and grading format used in the scoring process involved in the FMS [25,26]. The protocols for conducting the FMS tests require specific instructions that prevent the rater from providing cues for correcting movement and/or providing too much information. This is beneficial for supporting rater reliability, but it does not address the potential concern of participant knowledge of the FMS movements and the scoring process that could alter the screening process [27]. Research has revealed that the FMS protocol is less effective in determining dysfunctional movement patterns when participants have prior knowledge of the correct movement patterns needed to execute each exercise properly [28]. This supports the suggested protocols for conducting the screening exercises, which requires raters to avoid informing participants of correct movement execution beyond stating what potion to start the exercise in prior to the screening protocol [12]. Therefore, it is suggested to utilize two FMS certified raters when conducting the screening process. This process should include proper implementation of all FMS testing guidelines, thus supporting the reliability efforts of the data collection procedures discussed in recent research findings [29].
Utilization of two certified FMS raters during testing protocols is supported by research, which suggests there is an increase in reliability on scoring due to the ability to assess from two different views [12,22]. This also allows for the raters to collaborate and review scores based on more than one angle of view [30]. The research design utilized in this study involved two raters observing participants from two different angles, including frontal and sagittal planes of movement. The FMS protocols encourage raters to take the lowest score for each exercise, which is common practice when performing exercise assessments [12]. The FMS testing guidelines provides clear instructions for raters to take the lowest score, leaving room for improvement for the participant and drawing attention towards addressing the implementation of corrective exercises to improve movement patterns observed during the screening process [12,26]. Furthermore, research reveals that inter-rater reliability should involve steps to avoid bias including the unfamiliarity of participants involved in the study. This process helps to control the effect of inter-rater reliability due to the use of two non-bias raters collaborating on FMS scores for each participant [22]. Intra rater reliability should be addressed by ensuring each participant’s knowledge of the FMS is assessed prior to participation [21]. Lack of participant knowledge and experience in FMS testing could helped to ensure that participants do not alter their performance based on prior knowledge of performing any of the seven exercises involved in the screening protocol [21,23]. Likewise, researchers should follow proper testing protocols for executing each exercise included in the FMS handout; this ensures that the raters do not “coach” athletes through the testing protocol [13,29]. These testing guidelines help to ensure that the outcomes of each movement are natural and not adjusted in order to receive a higher score [31].
In summary, research supports the use of the FMS assessment tool and may be useful in identifying trends in movement patterns and potential deficiencies in different types of high performing runners, such as collegiate distance runners, sprinters and jumpers. By doing so, researchers and coaches may be able to address concerns for improving movement economy and muscular flexibility as a precaution for preventing future injuries while also improving performance. The purpose of this study was to utilize the FMS to identify differences in movement patterns between distance runners, sprinters and jumpers involved in a collegiate track program. The research question for this study states: Is there a difference in FMS scores between long distance runners (LD) and short distance runners and jumpers (SDJ)? The research hypothesis states: There will be a significant difference in FMS scores between long distance runners (LD) and short distance runners and jumpers (SDJ). The null hypothesis states: There is no significant difference in FMS scores between long distance runners (LD) and short distance runners and jumpers (SDJ).
Research Design
This study utilized a quantitative approach to examine the differences in functional movement patterns reported in long distance (LD) and short distance runners and jumpers (SDJ). Functional movement patterns were assessed using the Functional Movement Screen (FMS) to compare deficiencies in movement patterns between the two groups. The independent variables (IV) in this study included the two groups, the long-distance runners (LD) and the short distance runners and jumpers (SDJ). The dependent variable (DV) measured was the results from the FMS scores. The results of the FMS scores were compared between both groups using a Mann-Whitney U test. Follow up assessments were made to determine the significance between the lower limb exercises assessed within the FMS protocols.
Participants and Sample Selection
Participants recruited for this research study included both male and female long and short distance running and jumping athletes aged 18-28 years from an NCAA DII collegiate track and field program. Participants were also selected based on ability to perform all seven FMS exercises [19]. Inclusion criteria required all participants to be active members of the track and field program and free of any current musculoskeletal injuries. Upon being screened for injury and providing informed consent, participants were broken up into two separate categories, including long distance runners (LD) and short distance runners and jumpers (SDJ). Participants that were competing in running events 800m or further on the track were placed in the long distance (LD) running group. Participants competing in the 400m run or shorter, including sprinting and jumping events, were placed in the short distance and jumpers (SDJ) group. A total of 30 participants (N = 30) were involved in this study, including fifteen long distance runners (LD = 15) and fifteen short distance runners and jumpers (SDJ = 15). The LD group included seven female (n = 7) and eight male (n = 8) participants. The SDJ group included six female (n = 6) and nine male (n = 9) participants. The number of participants was limited due to the size of the track program and the ongoing need for coaches to recruit more distance runners and sprinters the following season. The testing also took place during the off-season, so some athletes were not on campus or unavailable during the testing period. No participants experienced injury during or immediately following the FMS testing protocols.
Instrumentation
The instrument used in this research study included the FMS Test Kit, which was used for the physical screening process to determine FMS scores in all participants. The FMS testing protocol involves a series of seven exercises performed in sequential order [29]. The seven exercises include the following: Deep Squat, Hurdle Step, In-line Lunge, Shoulder Mobility, Active Straight-Leg Raise, Trunk Stability Push-Up, and Rotary Stability. Following the guidelines of the FMS manual, participants were allowed to perform each of the seven exercises up to three attempts. This included performing two clearing tests, the Press-Up and Posterior Rocking test, which help to identify possible causes for lack of movement or joint impingement. Each exercise is scored on a scale of 0-3 points, with 0 representing pain during performance, 1 represents the inability to successfully execute the movement pattern, 2 reflecting some improper movement during the completion of the movement pattern, and 3 being a perfect score for executing the exercise correctly. Protocols for assessing individuals and assigning scores for each movement pattern using the FMS Test Kit can be found in the published FMS Home Study Course Manual [29].
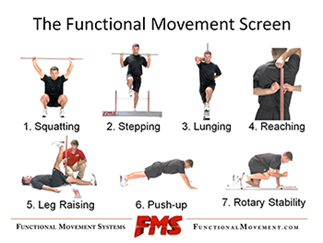
Figure 1: Image of Functional Movement Screen Tests
The FMS Test Kit includes a 5-foot plastic board (2 x 6 feet), along with one 4-foot dowel, two 2-foot dowels, and an elastic red tube with loops on each end that are used for the Step Over exercise. This equipment is used for five of the seven functional movement exercises involved in the screening protocols, while the Shoulder Mobility only requires the use of the dowel for measuring distances between fists and Trunk Stability Push-Up requires no equipment to execute. The large dowel is used for many of the tests, including the Deep Squat, Hurdle Step, In-line Lunge, and Active Straight-Leg Raise. The plastic board is used for the Hurdle Step, Inline Lunge, Active Straight-Leg Raise, and Rotary Stability. The smaller dowels and the red rubber tube are only used for the Hurdle Step exercise. Instructions on the execution of each exercise and the proper application of equipment can be found in the FMS Manual [29].
Data Collection
Data collection involved the assessment of functional movement patterns using the FMS Kit. This sequential seven-exercise protocol was used to screen for deficiencies in movement patterns while performing common functional movements often utilized in sport and daily activities [12]. Participants from both training groups were assessed once while wearing the preferred shoe for training (i.e., running shoes). The FMS scores were gathered using the FMS “Score Sheet” provided in the FMS Manual. Differences in FMS scores were compared between the LD and the SDJ groups.
Student undergraduate research assistants were directly involved in the data collection process. The lead investigator (PI), a faculty member within the Department of Kinesiology at Fresno State University, helped train and grade initial FMS exercises alongside the student research assistants while data was gathered using FMS scoring sheets. The student researchers continued to gather the majority of data by following the FMS testing protocols on participants from both the LD and SDJ groups. All researchers involved in the testing protocols collaborated in discussing outcomes to ensure consistency was achieved within testing protocols. This collaboration of raters was aimed at ensuring FMS testing procedures met the recommended interrater and intrarater reliability standards [21,22,25]. All data was be recorded using FMS scoring sheets and transferred into an Excel spreadsheet that was reviewed by the PI. Student research assistants took the lead on setting up the FMS equipment and organized testing schedules with all participants involved throughout the testing process.
Figure 2: Image of Functional Movement Screen testing Kit
Data Analysis
The data from this study was recorded in an Excel spreadsheet and analyzed using IBM SPSS software. FMS scores were collected using the recommended execution of instrumentation and exercise assessment procedures. The FMS data was initially recorded by hand using an FMS Score Sheet, which provided space for the researcher/rater to record height in inches and weight in pounds of each participant, and score all seven of the exercises involved in the FMS protocol [29]. In order to relate the assessments directly to the targeted population (i.e., runners and jumpers), only the lower limb tests were analyzed and discussed on the results of this study.
A Mann-Whitney U test was performed to determine if a significant relationship exists between the two groups based on recorded FMS scores [32]. A chi square table was used to reveal the level of significant difference between the two groups tested was based on the value of difference between the overall FMS scores between the two groups in comparison to the critical value. The level of significance between the two measurements was established at p < .05. Mean values and standard deviations for the FMS were calculated and recorded separately for the LD and SDJ groups.
Results
The results revealed a significant difference between the LD and SDJ groups on overall FMS scores (p < 0.001), which supports the research hypothesis. The results also revealed that the SDJ group scored higher than the LD group in three of the four lower extremity movement patterns. There was a significant difference between the two groups based on the Deep Squat (p = 0.040), Hurdle Step (p = 0.015), and In-line Lunge (p = 0.013).
Table 1: Comparison of FMS Lower Limb Scores Between LD and SDJ Groups
Table 1 reveals the results from all four of the lower extremity FMS exercises. The Deep Squat, Hurdle Step, and In-line Lunge exercises revealed a higher mean (x) and lower standard deviation (SD) in the SDJ group than the LD group. There was no significant difference between the LD and SDJ groups in the Active Straight-Leg Raise (p = .064). The mean FMS scores out of a 21-point maximum revealed a level of significance between both groups (p < 0.001); LD = 14.3 + 2.0 and SDJ = 17.3 + 1.2. Upper extremity exercises were not included in Table 1 since the lower extremity exercises were determined to be the most applicable and transferable exercises relating to the biomechanical movement patterns in running and jumping activities.
To address meso-level barriers, a second strategy is to integrate group- or peer-supported rehabilitation activities that provide shared experiences, accountability, and a sense of belonging. While practitioners often discuss the importance of social or peer support with patients, it is far less common to see these approaches integrated into treatment plans. This approach would address the lack of social support and isolation that many girls and women report as a barrier. Peer or group support might be particularly useful during transitions from inpatient rehabilitative care settings. As Mugasi & Papadimitriou (2021) suggested, there are many considerations for implementing this type of change into the rehabilitation process such as ideal times or moments for implementation, preferred environment for support (e.g., in therapy clinics, conference rooms), and modalities (e.g., in person, phone). Offering small group or partner-based exercises or creating culturally-specific rehab spaces might be beneficial for promoting adherence to treatment among girls and women specifically.
Discussion
Among the seven fundamental movement exercises involved in the FMS, the SDJ group observed higher overall results suggesting greater mobility, stability, and neuromuscular coordination when compared to the LD group. Several studies give potential explanations as to why the sprinters and jumpers may have scored higher in the deep squat, in-lunge, and hurdle step-over exercises [33]. One possible reason for this outcome could be the addition of sport-specific resistance training that many sprinters and jumpers focus on more than distance runners [20]. Participants involved in the SDJ group were required to lift three days a week during season, compared to the LD group which lifted less often due to the volume of running they experience. Therefore, the SDJ group is likely to be involved more often in training movement patterns similar to those presented in the FMS screening process [34]. Sport-specific movements are used in the majority of athletics are designed to build strength, mobility, stability, and neuromuscular coordination, which increases athletic performance in competition [35,36].
Previous research has revealed positive outcomes amongst higher achieving athletes suggesting sport-specific resistance training induces neural adaptations that improve motor skill development [36]. These findings support the idea that neural adaptations increase motor unit synchronization, which further increases neuromuscular coordination underlying the technical aspect of skill performance. The more familiar an individual becomes with specific movements patterns, the greater they may be able to perform when replicating the movement [36]. Knowing that the SDJ group regularly incorporated sport-specific resistance training into their weekly routines, this group would have had physiological and biomechanical advantages when replicating lower extremity movement patterns [37,38]. Differences in scores between the LD and SDJ groups could indicate these benefits.
Likewise, differences in FMS scores could be attributed to biomechanical movement patterns that differentiate between the shorter and longer distance runners [14]. The primary goal of sprinting is to generate maximal velocity in a short amount of time [33]. To produce maximal speed, power and explosiveness are key factors. Proper sprinting form includes triple flexion of the lead leg (hip, knee, and ankle), in combination with triple extension of the back leg (hip, knee, and ankle plantar flexion). A high knee lift at a 90-degree angle is also utilized to help the runner cycle through each step and propel the runner in a forward direction towards the finish line [33]. The position of the body during a sprint requires greater flexibility in the hamstrings and mobility in the hips to keep the knee at a 90-degree angle [20,33].
A study on hip flexion in distance runners and sprinters demonstrated that sprinters display approximately 10-158° more flexion at the hip joint than distance runners [37]. Distance running, on the other hand, requires different biomechanical needs, such as a knee angle of 45-60°, and tight Achilles and calf muscles for maximizing elastic energy storage and return [1,3]. Previous research has revealed that inflexibility in certain areas of the musculoskeletal system may enhance running economy in sub-elite male runners by increasing the storage and return of elastic energy while minimizing the need for muscle-stabilizing activity [3]. The differences in maximal and submaximal paces require different physiological responses from the body. In fact, research involving the comparison of same speeds on a treadmill between distance runners and sprinters found that even when distance runners attempted to sprint, there was still a 118° difference in the minimum hip angle [33].
There is substantial evidence supporting the possibility that sport specific training and performance adaptations could affect FMS screening outcomes. However, further research is necessary to understand the relationship between lower FMS scores in distance runners and its impact on performance. There is some support from research suggesting that the lack of flexibility in distance runners could be indicative of the repetitive nature of the sport and actually benefit performance [3,8]. Exploring the impact on decreases in flexibility and the positive increase greater elastic return, allowing runners to increase the overall running economy should be explored further. The relationship between muscle stiffness in distance runners and the associated movement patterns could suggest a shift in expectations for mobility screening outcomes for future assessments in this particular population of athletes.
Limitations
Limitations in this study include differences between training ages, loads and routines between the LD and SDJ groups as well as the use of shoes worn during testing. As discussed above, the training loads and mode of training differentiate between both groups of participants, which may have a direct impact on mobility capacity and FMS outcomes. Likewise, shoe material varied between foam and carbon-based running shoes used by participants during the testing phases. Participants included 25 athletes with foam-based shoes and 5 with carbon-based shoes. The effect of shoe type on FMS scores is unclear; future research should examine footwear effects when administering movement screening assessments in similar athletic populations. Another limitation could include the relatively small sample size of 30 participants. The number of participants was limited due to the size of the track program and the ongoing need for coaches to recruit more distance runners and sprinters the following season. The testing also took place during the off-season, so some athletes were not on campus or unavailable during the testing period. Limitations could include participant activity outside of testing periods relating to fatigue leading up to performance of the FMS testing protocols. There was no way to control participant activity levels, diet, recovery, or other lifestyle factors that may have influenced performance on testing days.
Conclusion
The FMS scores from this study indicate that sprinters and jumpers scored significantly higher (p < 0.001) than distance runners overall, particularly in the lower extremity movement patterns. These results suggest that sprinters and jumpers exhibit FMS movement patterns that may reflect greater mobility and stability, potentially influenced by sport-specific neuromuscular adaptations. However, it is also important to disclose the differences in preparatory training. Sprinters and jumpers engage in training that involves sport- specific resistance exercises, resulting in larger resistance training volume that may correlate better with FMS exercise performance. Whereas, the distance group did not spend as much time performing these exercises, potentially putting these participants at a greater disadvantage in performing the lower extremity exercises involved in the FMS testing protocol. Sprinting, jumping, and distance running also require different physiological and biomechanical needs relative to daily training and performance demands. One focusses on maximal speed and power, while the other engages in sustained submaximal efforts for much longer periods of time. Differences between the performance demands of these athletes may indicate that FMS scores have less of an impact on running performance and overall results than previously believed.
Competing interest:
The authors declare that they have no competing interests.
References
Daniels, J., & Daniels, N. (1992). Running economy of elite male and elite female runners. Medicine and Science in Sports and Exercise, 24(4), 483-489. View
Saunders, P. U., Pyne, D. B., Telford, R. D., & Hawley, J. A. (2004). Reliability and variability of running economy in elite distance runners. Medicine and Science in Sports and Exercise, 36(11), 1972-1976. View
Criab, M. W., Mitchell, V. A., Fields, K. B., Cooper, T. R., Hopewell, R., & Morgan, D. W. (1996). The association between flexibility and running economy in sub-elite male distance runners. Medicine & Science in Sports & Exercise, 28(6), 737–743. View
Foster, C., & Lucia, A. (2007). Running economy: The forgotten factor in elite performance. Sports Medicine, 37(4), 316-319. View
Barnes, K. R., & Kilding, A. E. (2015). Running economy: Measurement, norms, and determining factors. Sports Medicine Open, 1(1), 8. View
Hotta, T., Nishiguchi, S., Fukutani, N., Tashiro, Y., Adachi, D., Morino, S., Shirooka, H., Nozaki, Y., Hirata, H., Yamaguchi, M., & Aoyama, T. (2015). Functional movement screen for predicting running injuries in 18- to 24-year-old competitive male runners. Journal of Strength and Conditioning Research, 29(10), 2808- 2815. View
Hunter, G., Katosoult, K., Mccarthy, J., Ogard, W., Bamman, M., Wood, D., Den Hollander, J., Blaudeau, T., & Newcomer, B. (2011). Tendon length and joint flexibility are related to the running economy. Medicine & Science in Sports & Exercise, 43(8), 1492–1499. View
Li, F., Newton, R. U., Shi, Y., Sutton, D., & Ding, H. (2019). Correlation of eccentric strength, reactive strength, and leg stiffness with running economy in well-trained distance runners. Journal of Strength and Conditioning Research, Publish Ahead of Print. View
de Oliveira, R. R., Chaves, S. F., Lima, Y. L., Bezerra, M. A., Almeida, G. P. L., & de Paula Lima, P. O. (2017). There are no biomechanical differences between runners classified by the Functional Movement Screen. International Journal of Sports Physical Therapy, 12(4), 625.
Mokha, M., Romanes, J., Kostzer, K., Sprague, P., & Gatens, D. (2016, November). Correcting functional movement patterns reduces faulty running biomechanics. In ISBS-Conference Proceedings Archive. View
Zhang, Z., Chen, L., Qin, Z., He, J., Gao, C., Sun, J., ... & Li, D. (2024). Effects of functional correction training on movement patterns and physical fitness in male college students. Peer Journal, 12, e16878.
Cook, G., Burton, L., Kiesel, K. B., Rose, G., & Bryant, M. F. (2013). Movement: Functional Movement Systems– Screening, assessment, corrective strategies. Aptos, CA: On Target Publications. View
Beardsley, C., & Contreras, B. (2014). The Functional Movement Screen: A review. Strength and Conditioning Research, 36(5), 72-80. View
Hansen, C. E., Stensvig, M., Wienecke, J., Villa, C., Lorentzen, J., Rasmussen, J., & Simonsen, E. B. (2021). Factors correlated with running economy among elite middle-and long-distance runners. Physiological Reports, 9(20), e15076. View
Agresta, C., Slobodinsky, M., & Tucker, C. (2014). Functional Movement Screen – Normative values in healthy distance runners. International Journal of Sports Medicine, 35(14), 1203-1207. View
Loudon, J. K., Parkerson-Mitchell, A. J., Hildebrand, L. D., & Teague, C. (2014). Functional movement screen scores in a group of running athletes. The Journal of Strength & Conditioning Research, 28(4), 909-913. View
Waite, S., (2024). Relationship of BMI and FMS scores in college athletes. Journal of Rehabilitation Practices and Research, 5(2), 153. View
Chapman, R. F., Laymon, A. S., & Arnold, T. (2014). Functional movement scores and longitudinal performance outcomes in elite track and field athletes. International Journal of Sports Physiology and Performance, 9(2), 203-211. View
Cook, G., Burton, L., Fields, K., Kiesel, K. (1998). The Functional Movement Screen. Danville, VA: Athletic Testing Services Inc.
Naik, P. M., Viswanath, R. A., & Madhavi, K. (2015). Effect of muscle energy technique on the flexibility of hamstring and calf muscles and sprinting performance in sprinters. International Journal of Physiotherapy, 2(5). View
Gribble, P. A., Brigle, J., Pietrosimone, B. G., Pfile, K. R., & Webster, K. A. (2013). Intrarater reliability on the Functional Movement Screen. Journal of Strength and Conditioning Research, 27(4), 978–981. View
Minick, K. I., Kiesel, K. B., & Burton, L. (2010). Interrator reliability of the Functional Movement Screen. Journal of Strength and Conditioning Research, 24(2), 479-486. View
Onate, J. A., Dewey, T., Kollock, R. O., Thomas, K. S., Van Lunen, B. L., DeMaio, M., & Ringer, S. I. (2012). Real time intersession and interrater reliability of the Functional Movement Screen. Journal of Strength and Conditioning Research, 26(2), 408-415. View
Smith, C. A., Chimera, N. J., Wright, N. J., & Warren, M. (2013). Interrater and intrarater reliability of the functional movement screen. Journal of Strength and Conditioning Research, 27, 982-987. View
Elias, J. E. (2015). The inter-rater reliability of the Functional Movement Screen within an athletic population using untrained raters. Journal of Strength and Conditioning Research, (Publish Ahead of Print). View
Shultz, R., Anderson, S. C., Matheson, G. O., Marcello, B., & Besier, T. (2013) Test-retest and interrater reliability of the Functional Movement Screen. Journal of Athletic Training, 48, 331-336. View
Frost, D. M., Beach, T. A., Callaghan, J. P., & McGill, S. M. (2013). FMS™ scores change with performers' knowledge of the grading criteria - Are general whole-body movement screens capturing "dysfunction"? Journal of Strength and Conditioning Research, Post Acceptance, November 20, 2013. View
Frost, D. M., Beach, T. A., Callaghan, J. P., & McGill, S. M. (2011). Using the Functional Movement Screen to evaluate the effectiveness of training. Journal of Strength and Conditioning Research, 26(6), 1620-1630. View
Cook, G., Burton, L., Kiesel, K. B., Rose, G., & Bryant, M. F. (2011). The Functional Movement Screen: Home study course manual. Aptos, CA: On Target Publications. View
Teyhen, D. S., Shaffer, S. W., Lorenson, C. L., Halfpap, J. P., Donofry, D. F., Walker, M. J., Dugan, J. L., & Childs, J. D. (2012). The Functional Movement Screen: A reliability study. Journal of Orthopedic Sports Physical Therapy, 42, 530-540. View
Kraus, K., Schutz, E., Taylor, W. R., & Doyscher, R. (2014). Efficacy of the Functional Movement Screen: A review. Journal of Strength and Conditioning Research, 28(12), 3571-3584. View
Thomas, J. R., Nelson, J. K., & Thomas, K. T. (1999). A generalized rank-order method for nonparametric analysis of data from exercise science: a tutorial. Research Quarterly for Exercise and Sport, 70(1), 11-23. View
Bushnell, T., & Hunter, I. (2007). Differences in technique between sprinters and distance runners at equal and maximal speeds. Sports Biomechanics, 6(3), 261–268. View
Parchmann, C. J., & McBride, J. M. (2011). Relationship between functional movement screen and athletic performance. Journal of Strength and Conditioning Research, 25(12), 3378- 3384. View
Lacour, J. R., & Bourdin, M. (2015). Factors affecting the energy cost of level running at submaximal speed. European Journal of Applied Physiology, 115(4), 651–673. View
Judge, L., Moreau, C., & Burke, J. M. (2003). Neural adaptations with sport-specific resistance training in highly skilled athletes. Journal of Sports Sciences, 21(5), 419–427. View
Mann, R. A., & Hagy, J. (1980). Biomechanics of walking, running, and sprinting. The American Journal of Sports Medicine, 8(5), 345–350. View
Mokha, M., Leon, A., & Dean, W. Z. (2022). Biomechanics and movement pattern deficits in runners on the same university team: Implications for preventative sport healthcare. ISBS Proceedings Archive, 40(1), 479. View